
Investment Management
Macro Value Monitor

The Salient Views in the Rearview Mirror
1st Quarter, 2024
The coming 12 months are shaping up as the year of the interest-rate cut. After racing ahead with the most aggressive tightening campaign in decades during 2022 and 2023, central banks around the world are poised to begin easing monetary policy as inflation continues to retreat…
Plans to bring down rates hinge on inflation continuing to slow. Skeptics warn that prices mostly remain some way from central-bank targets, and that policy will need to remain tight.
~ Bloomberg, January 7, 2024
“A compass, I learned while I was surveying, it’ll point you true north from where you’re standing, but it’s got no advice about the swamps, deserts, and chasms that you’ll encounter along the way.
If in pursuit of your destination you plunge ahead heedless of obstacles, and achieve nothing more than to sink in a swamp…what’s the use of knowing true north?”
~ Sir Daniel Day Lewis, in Lincoln

Blue Sky Behind, Canyons Ahead
The past few years have seen a seismic shift in the market landscape, and it is worthwhile to pause for a few moments to reflect on how we got here, before considering where we might be headed. With inflation reappearing after a long absence, with the Treasury yield curve inverted in the shadow of historic bond market losses, and with multi-trillion-dollar deficits projected as far as the eye can see, the outlook appears quite unlike the historical view in the rearview mirror.
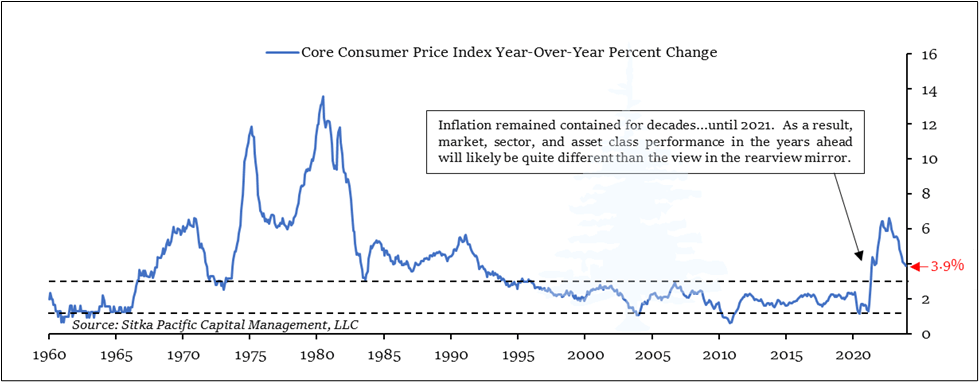
Twenty years ago, Alan Greenspan was grappling with the appearance of the lowest inflation rates since the mid-1960s. For the Federal Reserve chairman, inflation had become uncomfortably low. Worse, as the economy began to recover from the tech bust and the 2001 recession, the core rate of inflation kept drifting lower, continuing a mystifying downtrend that had begun in the mid-1990s. By 2003, two years after the end of the 2001 recession, the core rate of inflation had descended to a mere 1.1% year-over-year rate.
At the time, Greenspan worried the U.S. economy was on the verge of deflation – a modern central banker’s worst nightmare. The Federal Reserve’s First Great Mistake had been to casually allow a deflationary spiral to take hold two years after the stock market bubble burst in 1929, and the Fed under Greenspan was intent on preventing a similar outcome in the wake of the tech bust.
In response to the threat of deflation, Greenspan ushered in an entirely new era of monetary policy.
For the next twenty years, the Federal Reserve would deliberately maintain aggressively stimulative monetary policies long after economic downturns passed, in an effort to boost inflation rates that remained stubbornly, uncomfortably low. When Ben Bernanke took over as chairman, he followed through on his prior pledge to never allow the Great Mistake of the 1930s to be repeated; in response to the credit crisis in 2008, he drafted the Federal Reserve’s balance sheet into service for the first time since World War II.
Over the following decade, the Federal Reserve expanded its balance sheet and the base money supply 9-fold. At the same time, the Fed Funds rate was held below the rate of inflation. The direct result of those policies was a 21% loss in the purchasing power of cash equivalents, while the indirect impacts of the monetary expansion spread far and wide throughout asset markets. The most potent of these indirect impacts was transmitted through the bond market.
The average inflation rate which prompted this monetary expansion was indeed low: from 2009 to 2020, the consumer price index increased at an average annual rate of just 1.8%, below the Fed’s long-standing target of 2%. However, such periods of low inflation were not unique; they had been seen in earlier eras, without causing alarm.
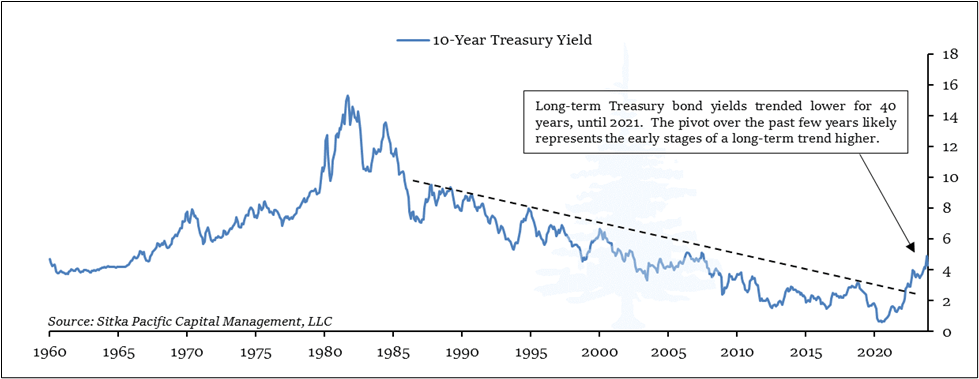
In the decade ending in 1965, for example, the headline consumer price index had also increased at an average annual rate of 1.8%. Yet during those low-inflation years, short-term interest rates fluctuated around 3%, and the yield on the 10-year Treasury yield fluctuated around 4%, as the Fed under McChesney Martin remained focused on long-term price stability.
In contrast, in the decade after the financial crisis, the Federal Reserve kept rates far lower than in the 1960s: between 2009 and 2022, short-term interest rates averaged just 0.5%, and the 10-year Treasury yield averaged 2.5%. And in 2020, as the 10-year Treasury yield hit the lowest yield in history at just 0.398%, fear of deflation was so pervasive that Fed Chair Jerome Powell re-branded the Fed’s 2% inflation target to enable even more stimulative monetary policies to be employed.
In an indirect result of those monetary commitments in 2020, the following year witnessed the first simultaneous trifecta of overvaluation in stocks, bonds, and real estate in U.S. history.
Shortly thereafter, in January 2022, we spent time reviewing the story of John Law and the Mississippi Bubble in the 1720s. The investing lessons imparted by the story of the Mississippi Bubble in France are timeless, yet they were particularly relevant at that moment. At times, the extraordinary nature of a market environment is best illuminated through the narrative of a similar moment in history, rather than by reciting all the statistics showing the extent of the exuberance.
A brief recap. In Paris in 1719 and early 1720, asset prices of all stripes rose dramatically due to a large expansion of the money supply and the speculative frenzy it fomented among wealthy Parisians. In late 1719, however, inflation had begun to arrive as the prices of everyday goods and commodities began rising alongside the spectacular rise in asset prices. It was at that moment, when the expanded supply of paper money began leaking out of financial assets into the broader economy, igniting widespread inflation, that the asset bubble in Company of the West shares came to an end.
Since publishing that narrative two years ago, a similar progression has unfolded in stocks, bonds, and real estate here in the U.S. Just as inflation arrived in 2021, the speculative frenzy of the meme-stock mania crested, and soon after the yields of the longest bonds began to rise – breaking the trend of sequentially lower yields in place since the early 1980s, shown in the chart above. As bond yields began to rise, other yields – such as the yield underlying stocks and real estate – began to rise as well. Outside the exuberance driving the Magnificent Seven over the past year, rising yields in stocks, bonds, and real estate (especially commercial real estate) have lowered valuations and real prices since inflation arrived.
The rise in yields in 2021 and 2022 also meant that bond prices were falling precipitously, and falling bond prices created an expanding sink hole in bank balance sheets. The growing pressure eventually sparked several bank runs in early 2023, most dramatically at Silicon Valley Bank.
A similar series of events had forced John Law to suspend redemption of banknotes at the Banque Royale in December 1719. However, it is important to note that in 2023 the pressure was felt not just in one bank, but throughout the entire banking system – and it crippled those banks that hadn’t hedged their interest rate exposure. In an echo of 1719, the systematic nature of the pressure prompted the Federal Reserve and the FDIC to guarantee all bank deposits in the wake of the Silicon Valley Bank run, as unrealized losses from bond holdings in the banking system spiraled higher and depositors fled.
As you can see on the chart below on the left, unrealized losses on the books of U.S. banks remains large:
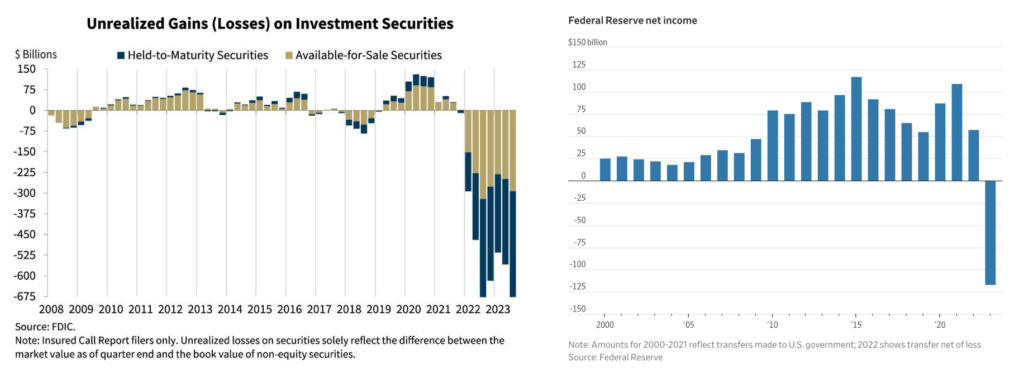
The Federal Reserve itself also felt enormous financial pressure from the pivot of inflation and bond yields. After doubling its balance sheet in 2020, 2021, and 2022 by buying Treasury and mortgage bonds when yields were at the lowest levels in history, the Federal Reserve rapidly and belatedly began increasing interest rates in mid-2022 to dampen inflation. As rates rose, the growing mismatch between the meager yield from its bond portfolio and the growing expenditure needed to pay rising interest rates on bank reserves produced the largest annual operating loss in Federal Reserve history in 2023. This operating loss is shown in the chart above, on the right.
The balance sheet losses for banks, as well as the large operating loss at the Federal Reserve, highlight how impactful the inflationary pivot has been over the past five years.
It also highlights how deceptively benign the salient views in the rearview mirror seemed leading up to 2022 and 2023. Historically, inflationary pivots like the one we have experienced over the past five years have broadly represented some of the highest-risk moments for investors, and these pivots can impact returns investors realize for many years afterward.
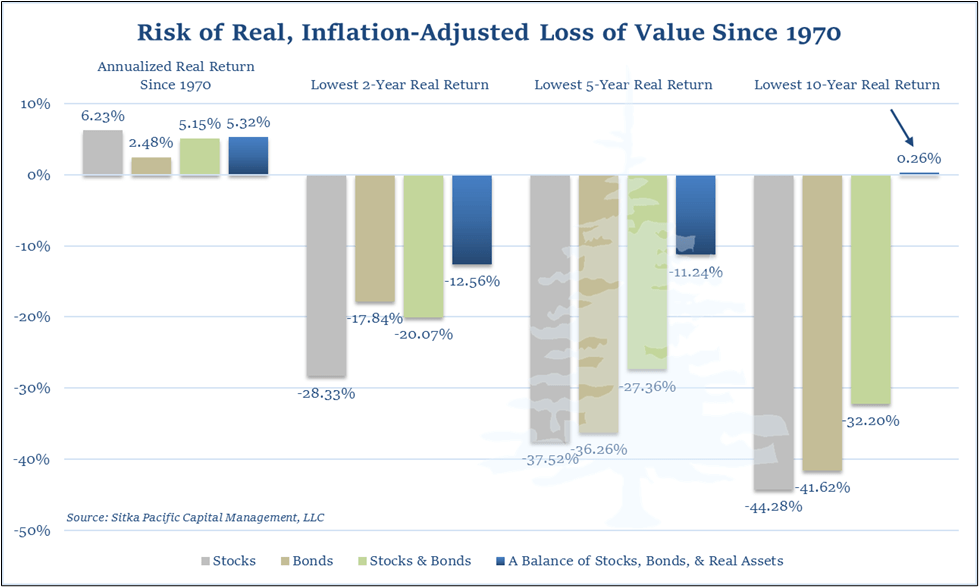
While real returns from stocks and bonds over the past half century since 1970 have been strong on average, almost all of the extended periods of negative real returns were realized in the 1970s and early 1980s, in the wake of the inflationary pivot in the late 1960s. For a portfolio of stocks and bonds, the largest negative 2-year and 5-year real returns were in the mid-1970s, and the lowest 10-year real return was seen in the decade ending in 1982. Only one return on the graphic below comes from the wake of the tech bust: the -44.28% real return from stocks in the decade after 1999.
This highlights that for a standard portfolio of stocks and bonds, an inflationary pivot can represent a greater long-term risk than even the end of a major stock market bubble.
It took just under twenty years for the Federal Reserve to bury its fear of deflation, and in the process of using its balance sheet to do so, the Fed has likely ensured higher rates of inflation for a generation. In the long run, aggregate prices eventually come to reflect the money supply, and the amount of money circulating in the U.S. and global economies today is many multiples of what it was when Greenspan ushered in a new era of monetary activism in 2003.
Since 1971, the consumer price index has risen at a 3.94% annualized rate. However, the growth rate of the Monetary Base has been 8.37% during that time. Moreover, since 2008 the base money supply has grown at an astounding 13.72% pace. Elevated monetary growth rates such as these eventually come to impact prices, and it appears that moment of impact arrived over the past five years.
For investors, managers, and advisors who focus exclusively on stocks and bonds, this inflationary pivot represents the largest risk to achieving positive inflation-adjusted returns in the years ahead.
However, incorporating real assets has historically mitigated much of the long-term risk inflation represents to a diversified portfolio. As is shown in the graphic above, the lowest 5-year real return of a balanced portfolio including real assets has been less than half the loss of a portfolio composed solely of stocks and bonds. In addition, there has been no 10-year time frame over the past half-century when a portfolio with a strong allocation to real assets had a negative real, inflation-adjusted return.
Real assets represent one of the few reliable asset classes that mitigate long-term inflation risk. While it is reasonable for investors to generally expect positive long-term real returns over time, portfolio returns in the years after inflationary pivots have been dramatically different than those long-term averages without a strong allocation to real assets.
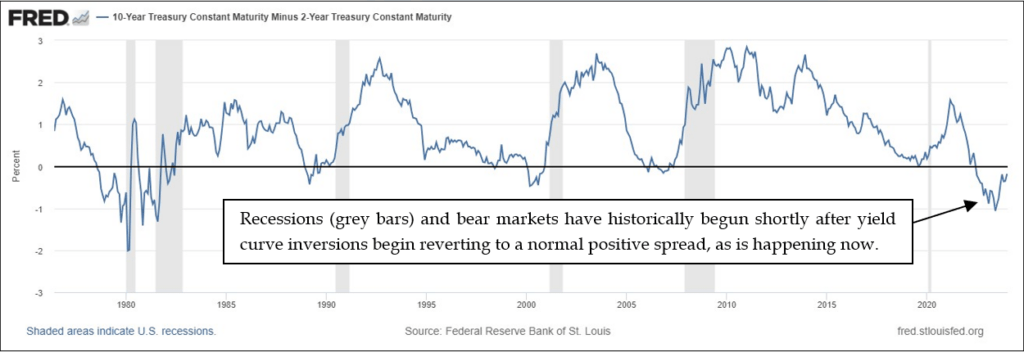
Returns dramatically different than long-term averages have also been seen over shorter time frames, particularly after strong recessionary signals such as an inverted yield curve. The current yield curve inversion has endured for the past eighteen months, and it appears the inversion ended 2023 in the early stages of reverting to normal. As is highlighted in the chart below, this has typically been a sign that the beginning of a recession is imminent.
For U.S. stocks and bonds these circumstances, the salient views in the rearview mirror may appear quite different from the real returns realized in the years ahead. With inflation having pivoted higher, yields throughout the financial markets have most likely embarked on a long-term trend higher. If so, this will result in real returns that depart significantly from those seen in recent decades – just as they departed significantly from long-term averages after prior inflationary pivots.
Yet for investors who maintain portfolios balanced with real asset allocations, the impact of inflation can be largely mitigated over the long-term.
This year is beginning with major market-cap weighted equity indexes having recovered their losses from 2022, while broader market indexes remain lower. The recession foretasted by the inverted yield curve has largely been written off by the consensus, as it did not appear right away in 2023. These circumstances are eerily similar to the last time a major yield curve inversion unwound, in the spring of 2007. Later that year, stocks rallied to a new high as interest rates began to fall, and investors cheered the continued resilience of the economy. A year after that fateful autumn, however, in the midst of the great recession and the throes of the credit crisis, there was little cheering left to be heard.
Only time will tell if a recession is in the cards following the current yield curve inversion. Until conditions normalize, the prudent course in the current market environment is one which resides in value with plenty of dry powder at the ready, and proceeds in full awareness of the swamps, deserts, and chasms that may lie ahead in 2024.
* * *
The preceding is part of our 1st Quarter letter to clients, which they received in January. To request a copy of the full letter, or to schedule a consultation to review your investments, visit Getting Started.
The content of this article is provided as general information and is for educational purposes only. It is not intended to provide investment or other advice. This material is not to be construed as a recommendation or solicitation to buy or sell any security, financial product, instrument or to participate in any particular trading strategy. Not all securities, products or services described are available in all countries, and nothing herein constitutes an offer or solicitation of any securities, products or services in any jurisdiction where their offer or sale is not qualified or exempt from registration or otherwise legally permissible.
Although the material herein is based upon information considered reliable and up-to-date, Sitka Pacific Capital Management, LLC does not assure that this material is accurate, current, or complete, and it should not be relied upon as such. Content in this document may not be copied, reproduced, republished, or posted, in whole or in part, without prior written consent — which is usually gladly given, as long as its use includes clear and proper attribution. Contact us for more information.
© Sitka Pacific Capital Management, LLC
The Salient Views in the Rearview Mirror
1st Quarter, 2024
The coming 12 months are shaping up as the year of the interest-rate cut. After racing ahead with the most aggressive tightening campaign in decades during 2022 and 2023, central banks around the world are poised to begin easing monetary policy as inflation continues to retreat…
Plans to bring down rates hinge on inflation continuing to slow. Skeptics warn that prices mostly remain some way from central-bank targets, and that policy will need to remain tight.
~ Bloomberg, January 7, 2024
“A compass, I learned while I was surveying, it’ll point you true north from where you’re standing, but it’s got no advice about the swamps, deserts, and chasms that you’ll encounter along the way.
If in pursuit of your destination you plunge ahead heedless of obstacles, and achieve nothing more than to sink in a swamp…what’s the use of knowing true north?”
~ Sir Daniel Day Lewis, in Lincoln
Blue Sky Behind, Canyons Ahead
The past few years have seen a seismic shift in the market landscape, and it is worthwhile to pause for a few moments to reflect on how we got here, before considering where we might be headed. With inflation reappearing after a long absence, with the Treasury yield curve inverted in the shadow of historic bond market losses, and with multi-trillion-dollar deficits projected as far as the eye can see, the outlook appears quite unlike the historical view in the rearview mirror.
Twenty years ago, Alan Greenspan was grappling with the appearance of the lowest inflation rates since the mid-1960s. For the Federal Reserve chairman, inflation had become uncomfortably low. Worse, as the economy began to recover from the tech bust and the 2001 recession, the core rate of inflation kept drifting lower, continuing a mystifying downtrend that had begun in the mid-1990s. By 2003, two years after the end of the 2001 recession, the core rate of inflation had descended to a mere 1.1% year-over-year rate.
At the time, Greenspan worried the U.S. economy was on the verge of deflation – a modern central banker’s worst nightmare. The Federal Reserve’s First Great Mistake had been to casually allow a deflationary spiral to take hold two years after the stock market bubble burst in 1929, and the Fed under Greenspan was intent on preventing a similar outcome in the wake of the tech bust.
In response to the threat of deflation, Greenspan ushered in an entirely new era of monetary policy.
For the next twenty years, the Federal Reserve would deliberately maintain aggressively stimulative monetary policies long after economic downturns passed, in an effort to boost inflation rates that remained stubbornly, uncomfortably low. When Ben Bernanke took over as chairman, he followed through on his prior pledge to never allow the Great Mistake of the 1930s to be repeated; in response to the credit crisis in 2008, he drafted the Federal Reserve’s balance sheet into service for the first time since World War II.
Over the following decade, the Federal Reserve expanded its balance sheet and the base money supply 9-fold. At the same time, the Fed Funds rate was held below the rate of inflation. The direct result of those policies was a 21% loss in the purchasing power of cash equivalents, while the indirect impacts of the monetary expansion spread far and wide throughout asset markets. The most potent of these indirect impacts was transmitted through the bond market.
The average inflation rate which prompted this monetary expansion was indeed low: from 2009 to 2020, the consumer price index increased at an average annual rate of just 1.8%, below the Fed’s long-standing target of 2%. However, such periods of low inflation were not unique; they had been seen in earlier eras, without causing alarm.
In the decade ending in 1965, for example, the headline consumer price index had also increased at an average annual rate of 1.8%. Yet during those low-inflation years, short-term interest rates fluctuated around 3%, and the yield on the 10-year Treasury yield fluctuated around 4%, as the Fed under McChesney Martin remained focused on long-term price stability.
In contrast, in the decade after the financial crisis, the Federal Reserve kept rates far lower than in the 1960s: between 2009 and 2022, short-term interest rates averaged just 0.5%, and the 10-year Treasury yield averaged 2.5%. And in 2020, as the 10-year Treasury yield hit the lowest yield in history at just 0.398%, fear of deflation was so pervasive that Fed Chair Jerome Powell re-branded the Fed’s 2% inflation target to enable even more stimulative monetary policies to be employed.
In an indirect result of those monetary commitments in 2020, the following year witnessed the first simultaneous trifecta of overvaluation in stocks, bonds, and real estate in U.S. history.
Shortly thereafter, in January 2022, we spent time reviewing the story of John Law and the Mississippi Bubble in the 1720s. The investing lessons imparted by the story of the Mississippi Bubble in France are timeless, yet they were particularly relevant at that moment. At times, the extraordinary nature of a market environment is best illuminated through the narrative of a similar moment in history, rather than by reciting all the statistics showing the extent of the exuberance.
A brief recap. In Paris in 1719 and early 1720, asset prices of all stripes rose dramatically due to a large expansion of the money supply and the speculative frenzy it fomented among wealthy Parisians. In late 1719, however, inflation had begun to arrive as the prices of everyday goods and commodities began rising alongside the spectacular rise in asset prices. It was at that moment, when the expanded supply of paper money began leaking out of financial assets into the broader economy, igniting widespread inflation, that the asset bubble in Company of the West shares came to an end.
Since publishing that narrative two years ago, a similar progression has unfolded in stocks, bonds, and real estate here in the U.S. Just as inflation arrived in 2021, the speculative frenzy of the meme-stock mania crested, and soon after the yields of the longest bonds began to rise – breaking the trend of sequentially lower yields in place since the early 1980s, shown in the chart above. As bond yields began to rise, other yields – such as the yield underlying stocks and real estate – began to rise as well. Outside the exuberance driving the Magnificent Seven over the past year, rising yields in stocks, bonds, and real estate (especially commercial real estate) have lowered valuations and real prices since inflation arrived.
The rise in yields in 2021 and 2022 also meant that bond prices were falling precipitously, and falling bond prices created an expanding sink hole in bank balance sheets. The growing pressure eventually sparked several bank runs in early 2023, most dramatically at Silicon Valley Bank.
A similar series of events had forced John Law to suspend redemption of banknotes at the Banque Royale in December 1719. However, it is important to note that in 2023 the pressure was felt not just in one bank, but throughout the entire banking system – and it crippled those banks that hadn’t hedged their interest rate exposure. In an echo of 1719, the systematic nature of the pressure prompted the Federal Reserve and the FDIC to guarantee all bank deposits in the wake of the Silicon Valley Bank run, as unrealized losses from bond holdings in the banking system spiraled higher and depositors fled.
As you can see on the chart below on the left, unrealized losses on the books of U.S. banks remains large:
The Federal Reserve itself also felt enormous financial pressure from the pivot of inflation and bond yields. After doubling its balance sheet in 2020, 2021, and 2022 by buying Treasury and mortgage bonds when yields were at the lowest levels in history, the Federal Reserve rapidly and belatedly began increasing interest rates in mid-2022 to dampen inflation. As rates rose, the growing mismatch between the meager yield from its bond portfolio and the growing expenditure needed to pay rising interest rates on bank reserves produced the largest annual operating loss in Federal Reserve history in 2023. This operating loss is shown in the chart above, on the right.
The balance sheet losses for banks, as well as the large operating loss at the Federal Reserve, highlight how impactful the inflationary pivot has been over the past five years.
It also highlights how deceptively benign the salient views in the rearview mirror seemed leading up to 2022 and 2023. Historically, inflationary pivots like the one we have experienced over the past five years have broadly represented some of the highest-risk moments for investors, and these pivots can impact returns investors realize for many years afterward.
While real returns from stocks and bonds over the past half century since 1970 have been strong on average, almost all of the extended periods of negative real returns were realized in the 1970s and early 1980s, in the wake of the inflationary pivot in the late 1960s. For a portfolio of stocks and bonds, the largest negative 2-year and 5-year real returns were in the mid-1970s, and the lowest 10-year real return was seen in the decade ending in 1982. Only one return on the graphic below comes from the wake of the tech bust: the -44.28% real return from stocks in the decade after 1999.
This highlights that for a standard portfolio of stocks and bonds, an inflationary pivot can represent a greater long-term risk than even the end of a major stock market bubble.
It took just under twenty years for the Federal Reserve to bury its fear of deflation, and in the process of using its balance sheet to do so, the Fed has likely ensured higher rates of inflation for a generation. In the long run, aggregate prices eventually come to reflect the money supply, and the amount of money circulating in the U.S. and global economies today is many multiples of what it was when Greenspan ushered in a new era of monetary activism in 2003.
Since 1971, the consumer price index has risen at a 3.94% annualized rate. However, the growth rate of the Monetary Base has been 8.37% during that time. Moreover, since 2008 the base money supply has grown at an astounding 13.72% pace. Elevated monetary growth rates such as these eventually come to impact prices, and it appears that moment of impact arrived over the past five years.
For investors, managers, and advisors who focus exclusively on stocks and bonds, this inflationary pivot represents the largest risk to achieving positive inflation-adjusted returns in the years ahead.
However, incorporating real assets has historically mitigated much of the long-term risk inflation represents to a diversified portfolio. As is shown in the graphic above, the lowest 5-year real return of a balanced portfolio including real assets has been less than half the loss of a portfolio composed solely of stocks and bonds. In addition, there has been no 10-year time frame over the past half-century when a portfolio with a strong allocation to real assets had a negative real, inflation-adjusted return.
Real assets represent one of the few reliable asset classes that mitigate long-term inflation risk. While it is reasonable for investors to generally expect positive long-term real returns over time, portfolio returns in the years after inflationary pivots have been dramatically different than those long-term averages without a strong allocation to real assets.
Returns dramatically different than long-term averages have also been seen over shorter time frames, particularly after strong recessionary signals such as an inverted yield curve. The current yield curve inversion has endured for the past eighteen months, and it appears the inversion ended 2023 in the early stages of reverting to normal. As is highlighted in the chart below, this has typically been a sign that the beginning of a recession is imminent.
For U.S. stocks and bonds these circumstances, the salient views in the rearview mirror may appear quite different from the real returns realized in the years ahead. With inflation having pivoted higher, yields throughout the financial markets have most likely embarked on a long-term trend higher. If so, this will result in real returns that depart significantly from those seen in recent decades – just as they departed significantly from long-term averages after prior inflationary pivots.
Yet for investors who maintain portfolios balanced with real asset allocations, the impact of inflation can be largely mitigated over the long-term.
This year is beginning with major market-cap weighted equity indexes having recovered their losses from 2022, while broader market indexes remain lower. The recession foretasted by the inverted yield curve has largely been written off by the consensus, as it did not appear right away in 2023. These circumstances are eerily similar to the last time a major yield curve inversion unwound, in the spring of 2007. Later that year, stocks rallied to a new high as interest rates began to fall, and investors cheered the continued resilience of the economy. A year after that fateful autumn, however, in the midst of the great recession and the throes of the credit crisis, there was little cheering left to be heard.
Only time will tell if a recession is in the cards following the current yield curve inversion. Until conditions normalize, the prudent course in the current market environment is one which resides in value with plenty of dry powder at the ready, and proceeds in full awareness of the swamps, deserts, and chasms that may lie ahead in 2024.
* * *
The preceding is part of our 1st Quarter letter to clients, which they received in January. To request a copy of the full letter, or to schedule a consultation to review your investments, visit Getting Started.
The content of this article is provided as general information and is for educational purposes only. It is not intended to provide investment or other advice. This material is not to be construed as a recommendation or solicitation to buy or sell any security, financial product, instrument or to participate in any particular trading strategy. Not all securities, products or services described are available in all countries, and nothing herein constitutes an offer or solicitation of any securities, products or services in any jurisdiction where their offer or sale is not qualified or exempt from registration or otherwise legally permissible.
Although the material herein is based upon information considered reliable and up-to-date, Sitka Pacific Capital Management, LLC does not assure that this material is accurate, current, or complete, and it should not be relied upon as such. Content in this document may not be copied, reproduced, republished, or posted, in whole or in part, without prior written consent — which is usually gladly given, as long as its use includes clear and proper attribution. Contact us for more information.
© Sitka Pacific Capital Management, LLC
Investment Management
Before investing, we will discuss your goals and risk tolerances with you to see if a separately managed account at Sitka Pacific would be a good fit. To contact us for a free consultation, visit Getting Started.
Macro Value Monitor
To read a selection of recent client letters and be alerted when new letters are posted to our public site, visit Recent Client Letters.