
Investment Management
Macro Value Monitor

Cap-Weighted Equity Indexes are About to Have a Moment
October 2023 Memo
The return of inflation has altered the investing landscape in a way last seen more than half a century ago.
The last time inflation and bond yields pivoted higher as they have over the past several years, Lyndon Johnson was president, McChesney Martin was chairman of the Federal Reserve, and the U.S. dollar was still officially tethered to gold.
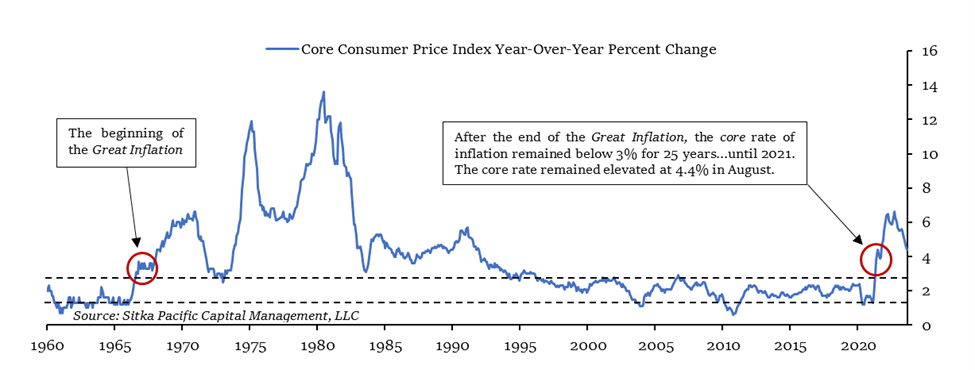
Investing in a more inflationary market environment is an exercise in knowing which parts of investing dogma and lore to hold onto, and which parts to let go in favor of a more informed approach.
The initial education from the secular pivot in 2022 was deeply felt by the traditional 60/40 portfolio of stocks and bonds; at its lowest point a year ago, a diversified portfolio of stocks and bonds had lost a quarter of its value in just nine months, with both stocks and bonds declining in tandem.
Such coincident losses had not happened in more than fifty years, and it demonstrated how vulnerable a portfolio can be to a secular lift-off of rates and yields.
Over the past year, there has been a partial rebound in a standard portfolio of stocks and bonds, as you can see by the blue line in the chart below on the left. However, the fragile underlying nature of this rebound should give all investors pause.
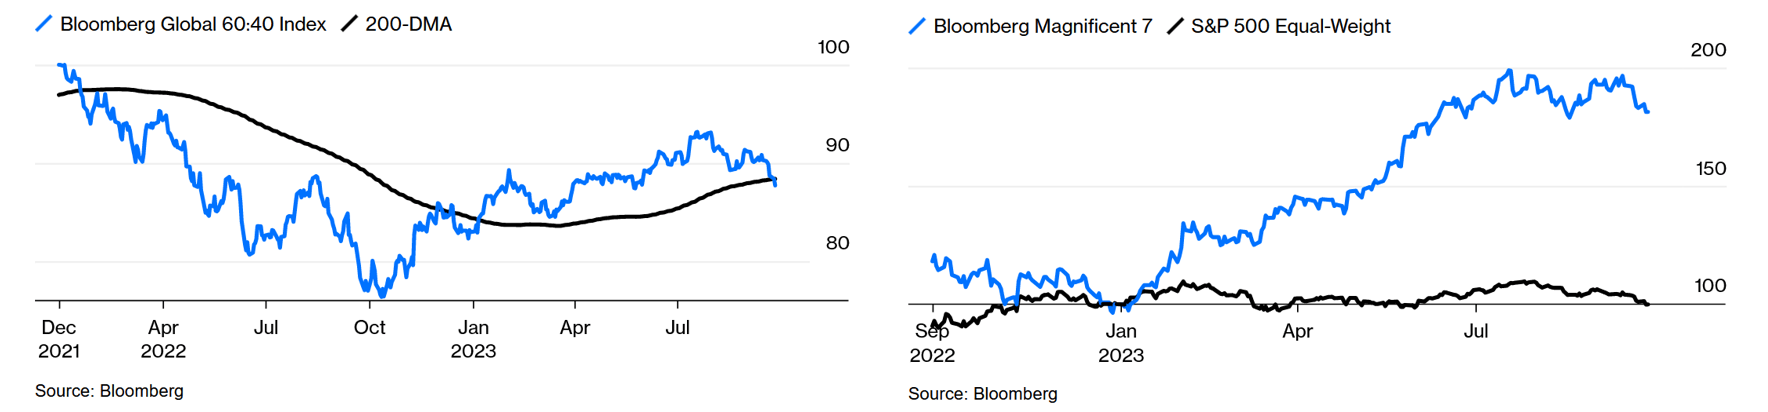
After a short-lived reprieve in the fourth quarter of 2022 and the first quarter of this year, bond yields began to rise (and bond prices began to fall) again in April – and have continued higher since then. Treasury and investment-grade corporate bonds have given investors a negative total return through the first nine months of this year, which threatens to give bond investors a negative return for three years in a row, absent a recovery by year-end – which would be a historical first.
With negative returns from bonds, the recovery of the standard portfolio through this quarter was fueled exclusively by gains in stocks. Yet it was not all stocks that powered the recovery, or even a majority of stocks: only seven stocks have been responsible for the gains in major equity indexes this year. Outside those Magnificent 7, the rest of the equity market remained stagnant.
Thus, the recovery this year has ridden on the backs of just a small handful of technology companies, companies which now together account for a very large portion of global public equity.
In fact, as shown below, the global equity market is now more concentrated in the hands of the top ten largest stocks than at any other time since the Nifty Fifty bubble in the mid-1970s:
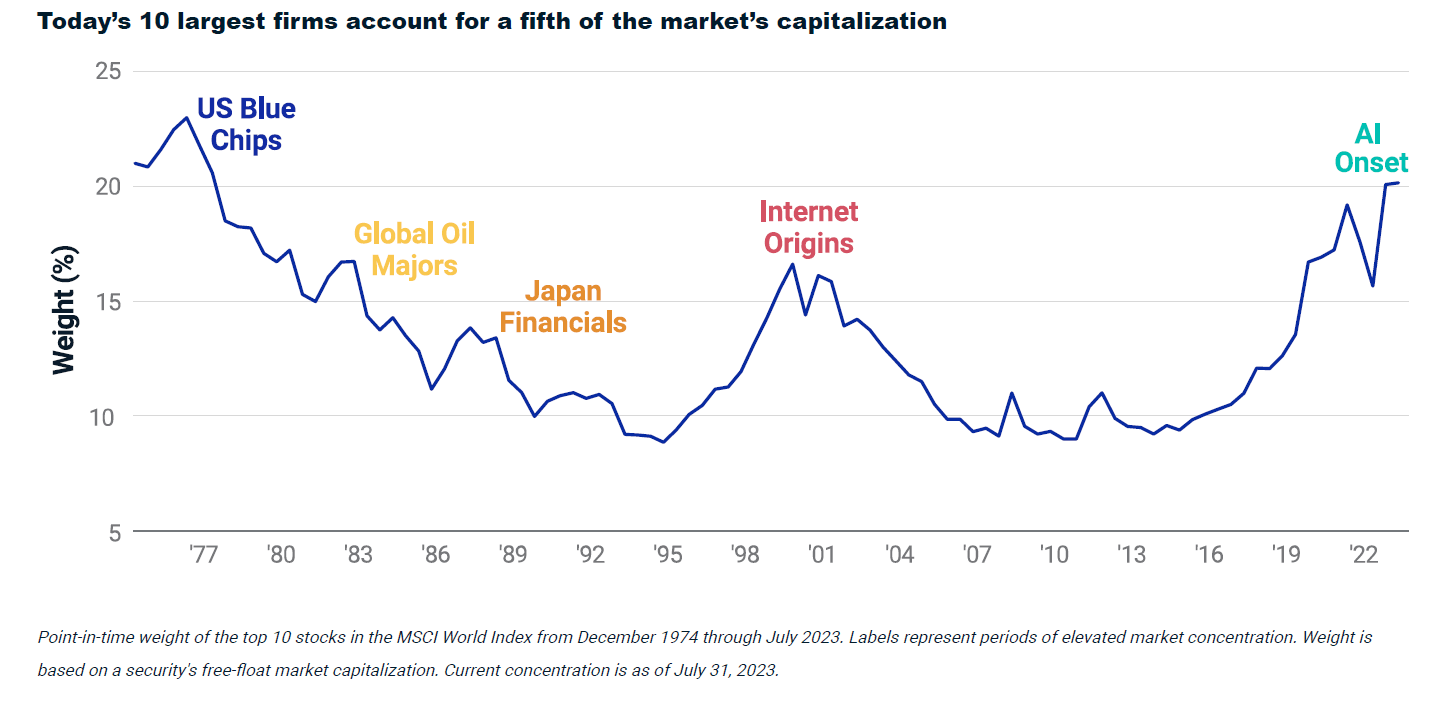
The graphic above, and the one below, are from a recent research note from index provider MSCI, entitled AI’s Moment and Insights from Themes Past.
The main message from the research note was simple: when a handful of stocks come to dominate a large share of global equity indexes, those largest stocks struggle in the years that follow.
This is demonstrated in the graphic below. The darker columns show the weight of the largest 10 stocks at their peak concentration of a global equity market index in prior eras, and the lighter columns show lower weight of those same stocks within the index a decade later:
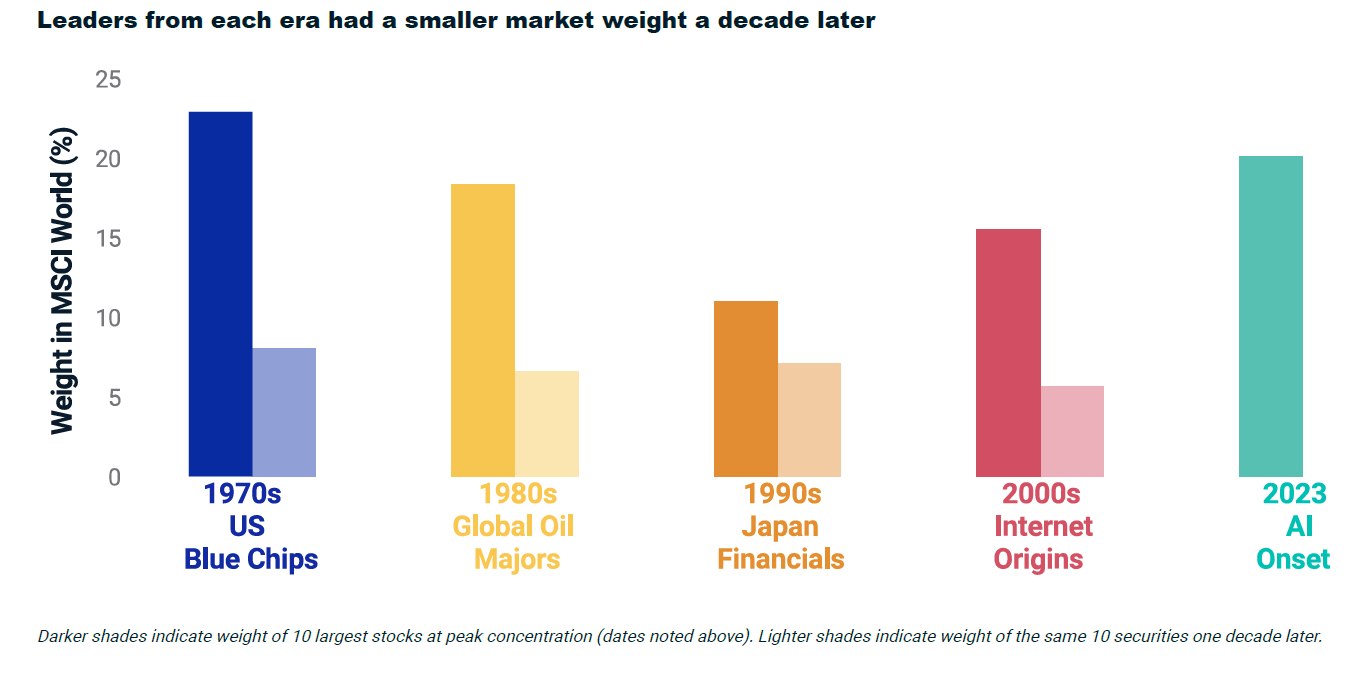
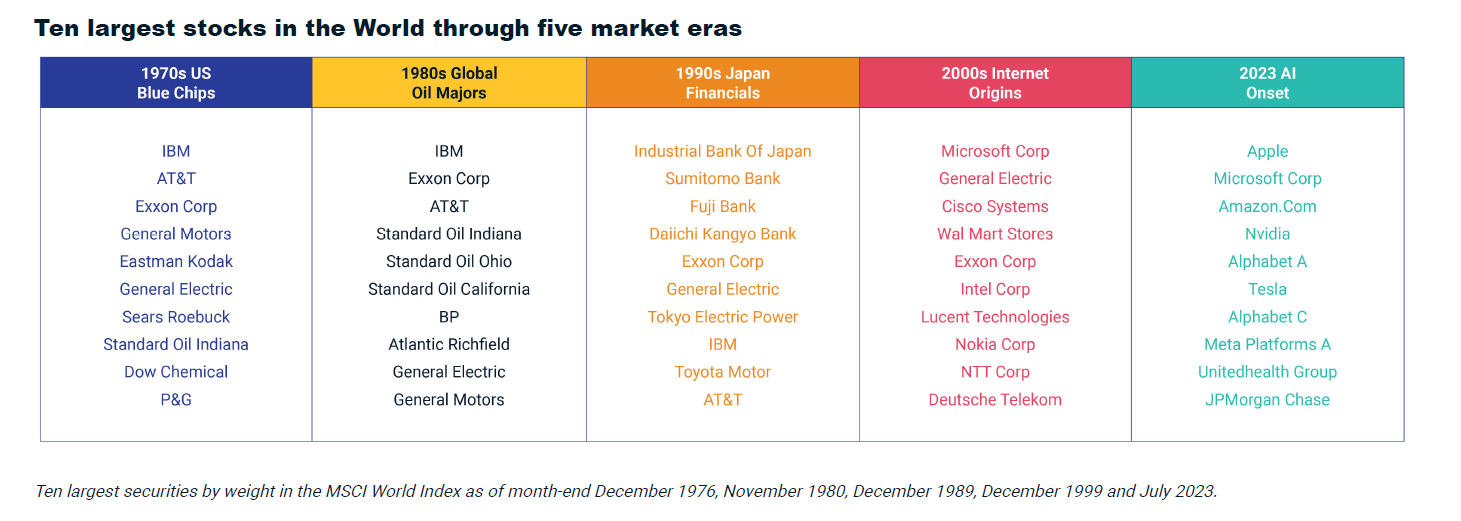
If you look through the list of companies in the graphic shown above, you’ll see many familiar names. Most of these companies have, in fact, been household names for decades, including General Electric, Exxon, and going all the way back to the 1970s – Sears Roebuck.
The companies listed above achieved a size and resilience that few businesses achieve, and at their peaks their stocks achieved something few stocks achieve – becoming one of the ten largest equities in the world.
Yet while most of those companies remain with us today, the unfortunate reality for investors is that only one-quarter of those managed to beat the rest of the world’s stocks in the decade after they reached the top 10. In other words, amid eras of extreme concentration like we have today, higher returns in subsequent years resulted from avoiding those largest stocks.
One additional aspect bears mentioning: today, the largest top 10 stocks are all U.S.-listed companies.
U.S. market-cap weighted indexes like the S&P 500, the Nasdaq 100, and even the Wilshire 5000 represent a focused exposure to this era of high global market concentration. The Magnificent 7 accounted for an astounding 30.5% of the S&P 500 this past month, up from 21.5% at the end of 2022.
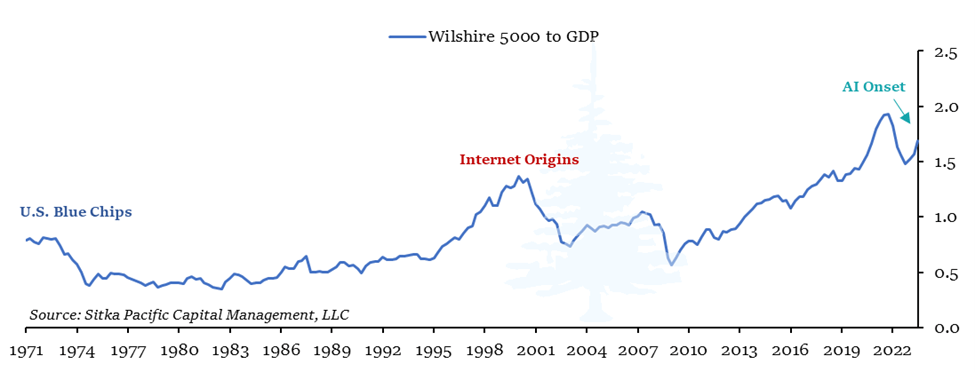
Three eras of peak U.S. concentration in world equity markets are highlighted below, and as you can see, these tend to occur near long-term valuation peaks for the U.S. equity market.
The high concentration in the equity market today means that portfolio allocations which track U.S. and global stocks on a market-cap-weighted basis are about to have a moment of pivotal long-term under-performance.
The good news is there are simple and effective solutions to avoiding the risks associated with an era of high equity market concentration, and we are ready to help.
When you are ready to move forward with a more resilient investment portfolio, visit Getting Started. We would be happy to implement a more resilient, all-weather investment management plan for your portfolio.
Sincerely,
Brian McAuley
Founder and Principal Advisor
Sitka Pacific Capital Management, LLC
Investment Advisors and Wealth Managers
If you would like to incorporate an absolute return SMA strategy to the range of investment options available to your clients, contact us for more information. We look forward to helping you and your clients achieve their goals with better risk-adjusted returns that are less correlated to the markets.
Sitka Pacific is listed in the InformaIS PSN database in the Global/International Balanced category.
Read a Selection of Recent Memos, Articles, and Client Letters
The content of this memo is provided as general information only and is not intended to provide investment or other advice. This material is not to be construed as a recommendation or solicitation to buy or sell any security, financial product, instrument or to participate in any particular trading strategy. Sitka Pacific Capital Management provides investment advice solely through the management of its client accounts. This copyrighted memo may not be copied, reproduced, republished, or posted, in whole or in part, without prior written consent from Sitka Pacific Capital Management, LLC.
Cap-Weighted Equity Indexes are About to Have a Moment
October 2023 Memo
The return of inflation has altered the investing landscape in a way last seen more than half a century ago.
The last time inflation and bond yields pivoted higher as they have over the past several years, Lyndon Johnson was president, McChesney Martin was chairman of the Federal Reserve, and the U.S. dollar was still officially tethered to gold.
Investing in a more inflationary market environment is an exercise in knowing which parts of investing dogma and lore to hold onto, and which parts to let go in favor of a more informed approach.
The initial education from the secular pivot in 2022 was deeply felt by the traditional 60/40 portfolio of stocks and bonds; at its lowest point a year ago, a diversified portfolio of stocks and bonds had lost a quarter of its value in just nine months, with both stocks and bonds declining in tandem.
Such coincident losses had not happened in more than fifty years, and it demonstrated how vulnerable a portfolio can be to a secular lift-off of rates and yields.
Over the past year, there has been a partial rebound in a standard portfolio of stocks and bonds, as you can see by the blue line in the chart below on the left. However, the fragile underlying nature of this rebound should give all investors pause.
After a short-lived reprieve in the fourth quarter of 2022 and the first quarter of this year, bond yields began to rise (and bond prices began to fall) again in April – and have continued higher since then. Treasury and investment-grade corporate bonds have given investors a negative total return through the first nine months of this year, which threatens to give bond investors a negative return for three years in a row, absent a recovery by year-end – which would be a historical first.
With negative returns from bonds, the recovery of the standard portfolio through this quarter was fueled exclusively by gains in stocks. Yet it was not all stocks that powered the recovery, or even a majority of stocks: only seven stocks have been responsible for the gains in major equity indexes this year. Outside those Magnificent 7, the rest of the equity market remained stagnant.
Thus, the recovery this year has ridden on the backs of just a small handful of technology companies, companies which now together account for a very large portion of global public equity.
In fact, as shown below, the global equity market is now more concentrated in the hands of the top ten largest stocks than at any other time since the Nifty Fifty bubble in the mid-1970s:
The graphic above, and the one below, are from a recent research note from index provider MSCI, entitled AI’s Moment and Insights from Themes Past.
The main message from the research note was simple: when a handful of stocks come to dominate a large share of global equity indexes, those largest stocks struggle in the years that follow.
This is demonstrated in the graphic below. The darker columns show the weight of the largest 10 stocks at their peak concentration of a global equity market index in prior eras, and the lighter columns show lower weight of those same stocks within the index a decade later:
If you look through the list of companies in the graphic shown above, you’ll see many familiar names. Most of these companies have, in fact, been household names for decades, including General Electric, Exxon, and going all the way back to the 1970s – Sears Roebuck.
The companies listed above achieved a size and resilience that few businesses achieve, and at their peaks their stocks achieved something few stocks achieve – becoming one of the ten largest equities in the world.
Yet while most of those companies remain with us today, the unfortunate reality for investors is that only one-quarter of those managed to beat the rest of the world’s stocks in the decade after they reached the top 10. In other words, amid eras of extreme concentration like we have today, higher returns in subsequent years resulted from avoiding those largest stocks.
One additional aspect bears mentioning: today, the largest top 10 stocks are all U.S.-listed companies.
U.S. market-cap weighted indexes like the S&P 500, the Nasdaq 100, and even the Wilshire 5000 represent a focused exposure to this era of high global market concentration. The Magnificent 7 accounted for an astounding 30.5% of the S&P 500 this past month, up from 21.5% at the end of 2022.
Three eras of peak U.S. concentration in world equity markets are highlighted below, and as you can see, these tend to occur near long-term valuation peaks for the U.S. equity market.
The high concentration in the equity market today means that portfolio allocations which track U.S. and global stocks on a market-cap-weighted basis are about to have a moment of pivotal long-term under-performance.
The good news is there are simple and effective solutions to avoiding the risks associated with an era of high equity market concentration, and we are ready to help.
When you are ready to move forward with a more resilient investment portfolio, visit Getting Started. We would be happy to implement a more resilient, all-weather investment management plan for your portfolio.
Sincerely,
Brian McAuley
Founder and Principal Advisor
Sitka Pacific Capital Management, LLC
Investment Advisors and Wealth Managers
If you would like to incorporate an absolute return SMA strategy to the range of investment options available to your clients, contact us for more information. We look forward to helping you and your clients achieve their goals with better risk-adjusted returns that are less correlated to the markets.
Sitka Pacific is listed in the InformaIS PSN database in the Global/International Balanced category.
Read a Selection of Recent Memos, Articles, and Client Letters
The content of this memo is provided as general information only and is not intended to provide investment or other advice. This material is not to be construed as a recommendation or solicitation to buy or sell any security, financial product, instrument or to participate in any particular trading strategy. Sitka Pacific Capital Management provides investment advice solely through the management of its client accounts. This copyrighted memo may not be copied, reproduced, republished, or posted, in whole or in part, without prior written consent from Sitka Pacific Capital Management, LLC.
Investment Management
Before investing, we will discuss your goals and risk tolerances with you to see if a separately managed account at Sitka Pacific would be a good fit. To contact us for a free consultation, visit Getting Started.
Macro Value Monitor
To read a selection of recent client letters and be alerted when new letters are posted to our public site, visit Recent Client Letters.