
Investment Management
Macro Value Monitor

The End of Ultra-Low Yields and the Standard 60/40 Portfolio
March 2, 2022
A bedrock of long-term investing, a portfolio split 60/40 between equities and high-quality bonds, posted its worst monthly slide since the market meltdown in the early days of the pandemic. Both equities and bond prices dropped sharply in January as markets priced in a faster pace of interest-rate tightening during 2022 from the Federal Reserve. The central bank’s hawkish pivot from mid-December intensified after last week’s policy meeting, with leading Wall Street economists calling for at least five and possibly as many as seven quarter-point rate hikes this year.
The Bloomberg 60/40 index lost 4.2% in January, reflecting a decline of 5.6% for large cap equities and a loss of 2.2% for the Bloomberg U.S. Aggregate bond index. That’s the worst showing since a slump of 7.7% in March 2020, when pandemic lockdowns plunged the economy into recession.
– Bloomberg, January 31, 2022
For equity markets, rising inflation was already a big concern. Russia’s attack on Ukraine means those worries just got a whole lot bigger. Vladimir Putin’s move to invade his neighbor led to a surge in the price of everything from oil and food to natural gas and aluminum, spikes that could choke economic activity and exacerbate a market rout.
Stocks across the world tumbled on the news, with major benchmarks in both Europe and the U.S. now firmly in correction territory and the Nasdaq 100 index entering a bear market. “The effects of recent events can therefore rightly be described as stagflationary — rising prices with declining economic activity,” said Thomas Boeckelmann, drawing parallels with the malaise that hit equity markets in the 1970s.
– Bloomberg, February 24, 2022
This month marks the anniversary of one of the most significant events of the past decade for investors in U.S. stocks and bonds. When the Covid-19 pandemic began to drag down the financial markets beginning in late February 2020, an unprecedented seismic shift struck the bond market.
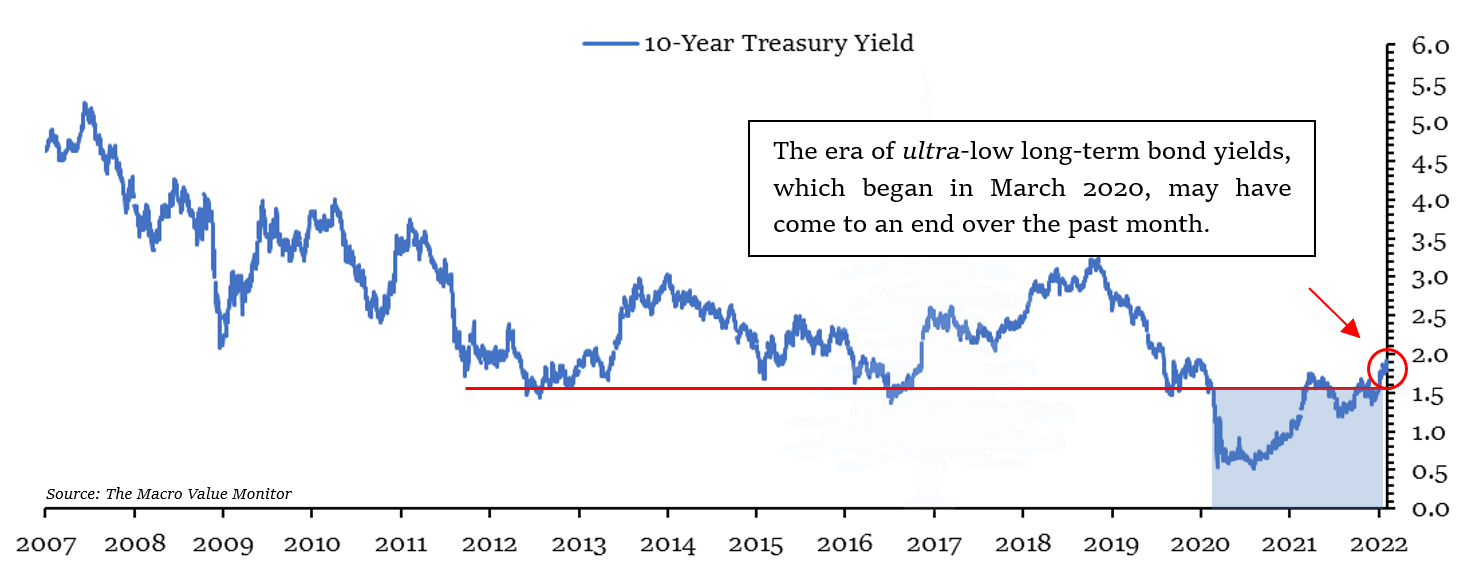
In the decade following financial crisis in 2008 and 2009, long-term Treasury bond yields settled into a trading range between 1.5% and 3.5%. This trading range persisted through the beginning and end of successive quantitative easing programs, and also through eight years of near-zero percent short-term interest rates. It also persisted through the Fed’s campaign to increase interest rates and shrink its balance sheet in 2017, 2018 and 2019. It was one of the most durable trends in the post-financial-crisis market landscape.
Yet among the many formerly stable market relationships that changed when the impact of the pandemic hit the economy and financial markets, the most significant for investors was the transition to ultra-low long-term interest rates. The 10-Year Treasury yield fell through the 1.5% floor on February 21st, 2020, then proceeded to decline to as low as 0.398% on March 9th. It was the lowest level ever recorded on the benchmark yield, going back a full century before the end of the last vestiges of the gold standard in 1971.
Most significantly, it remained below its former post-financial-crisis floor throughout the rest of 2020, and all of 2021. Even as inflation rates rose to 7% by the end of last year, the 10-Year Treasury yield remained below 1.5%, and yields throughout the rest of the bond universe remained low as well.
These ultra-low yields were due, in large part, to the Federal Reserve’s decision to backstop corporate and municipal bonds, including the bonds of companies that had been downgraded to junk due to the pandemic. Municipal bonds ended 2021 with an average yield of just above 1%, and AAA-rated corporate bonds yielded just 2.7%. Junk bonds — those at significant risk of default over their duration — offered an average yield of just 3.4%. With such paltry yields from bonds, all of which remained far below the inflation rate, investors and investment managers felt they had no choice but to embrace stocks — even with the broad equity market trading at record valuations.
The cascade of events set in motion from the new era of ultra-low yields in the bond market propelled a buying frenzy in stocks and other risk assets in late 2020 and 2021 as investors scrambled for yield, and the frenzy resulted in the lowest combined yield of a portfolio of U.S. stocks and bonds in history. In July of last year, the cyclically adjusted yield of a traditional 60/40 portfolio fell to 2.13%, the lowest portfolio yield going back to 1881 — lower even than the yields at the speculative peaks in 2000 and 1929. This combined portfolio yield ended 2021 at 2.14%, just one tick above its record low set in July.
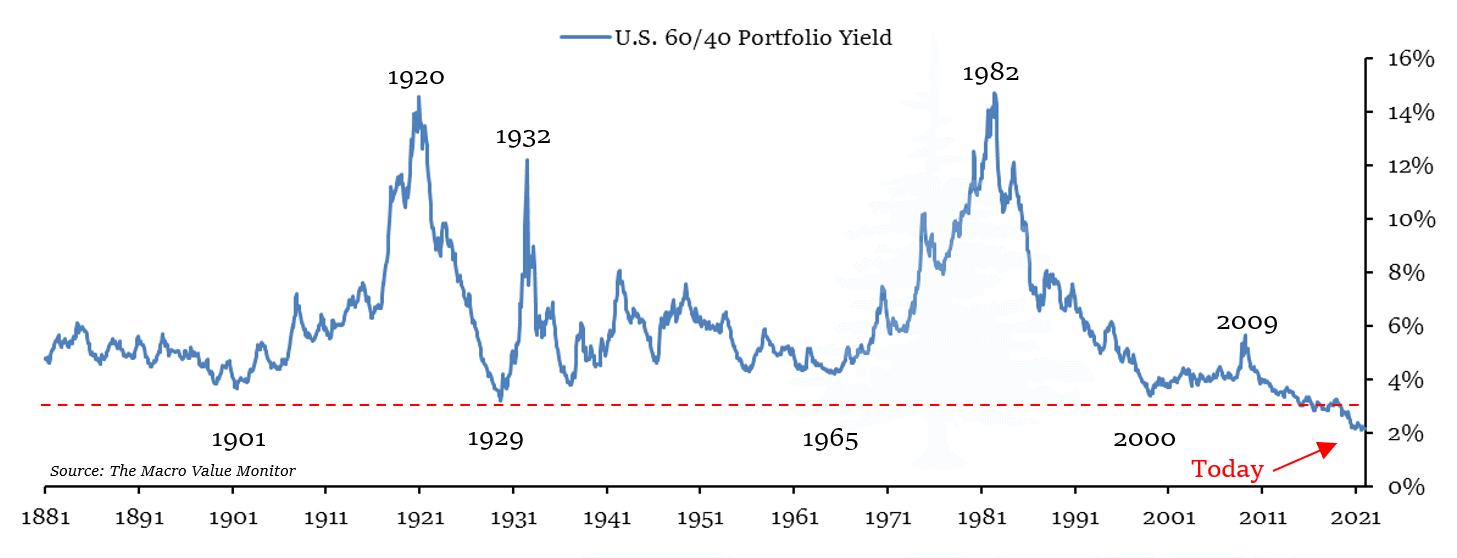
The visual history of the yield of the 60/40 portfolio in the chart above reveals that 2021 represented the worst environment in modern history to be invested in U.S. stocks and bonds. When the underlying yield of an investment is near 2%, it takes only a modest uptick in the market’s risk assessment to trigger significant losses.
It turned out that such an uptick in risk assessment began in the first week of this new year, as the market began pricing in a rising Fed Funds rate. As the 13-Week yield began to climb, signaling the market was beginning to expect the Federal Reserve to start raising interest rates within the first quarter, the price of both stocks and bonds began to retreat. By the end of the month, the standard 60/40 portfolio recorded a loss of 4.2%, the largest monthly loss since March 2020, a loss which deepened in February.
Yet while January’s 4.2% loss was the largest monthly decline for the standard 60/40 portfolio in two years, it marked only a modest improvement in the portfolio yield: the nominal yield climbed from 2.14% to 2.31%. A sub-3% yield on a combined 60/40 portfolio is a distinguishing feature of the current bubble in U.S. assets, and it would take much lower asset prices to increase the yield of stocks and bonds to where it was at the peaks in 2000 and 1929. At those speculative peaks, a portfolio of stocks and bonds yielded 3.7% and 3.4% respectively. These yields were 60% and 47% higher than at the end of January.
Since the year-over-year inflation rate climbed in January as well, rising to 7.5% from 7.1% in December, the inflation-adjusted yield of the combined 60/40 fell to a new low, despite the decline in stocks and bonds. At negative 5.17%, the real yield of a portfolio of stocks and bonds ended January at the lowest level since July 1947.
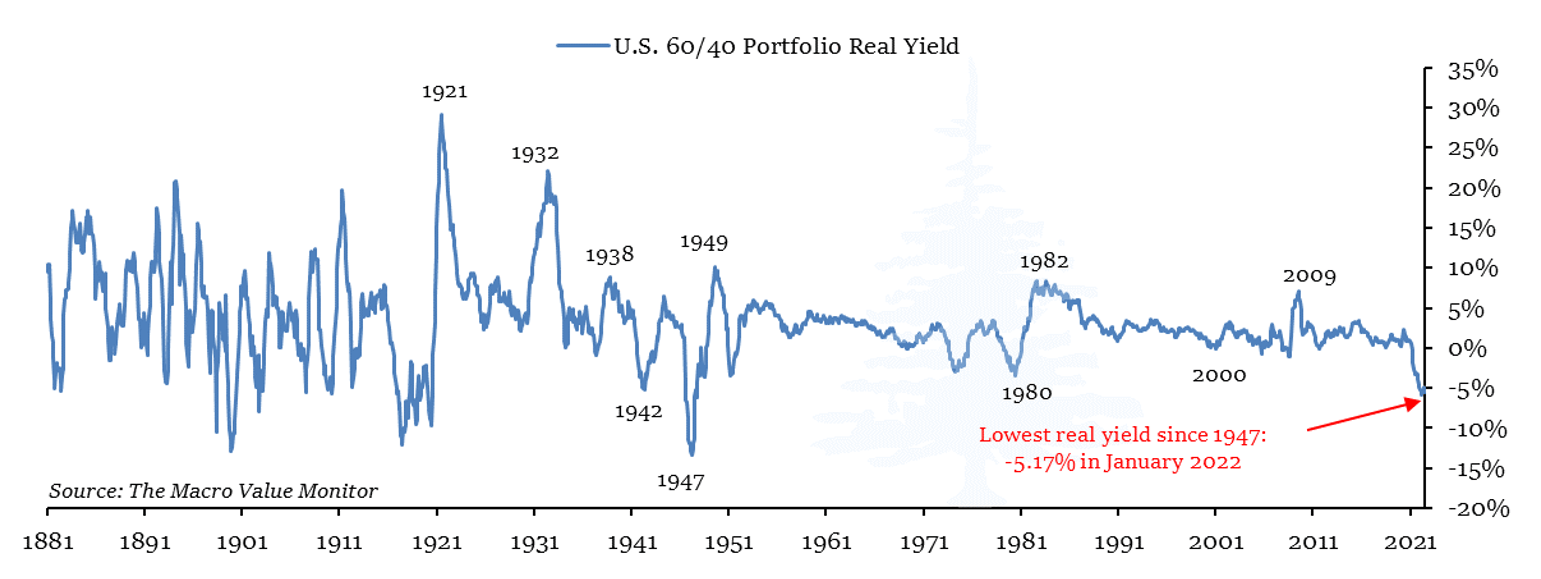
This is a very important dynamic to understand: with the rate of inflation having risen above all expectations over the past year, the real, inflation-adjusted yield of a 60/40 portfolio of U.S. stocks and bonds fell to a new low in January, even though the prices of stocks and bonds declined. In other words, 60/40 portfolio investors endured a 4% loss, but were left holding a portfolio that was more overvalued than it was before. This is the risk embedded in a nominal 2% portfolio yield in an environment of rising inflation.
If the era of ultra-low bond yields is in the process of ending, the sky-high equity market valuations those ultra-low yields fueled over the past two years will likely end as well. The 10-Year Treasury yield is currently at 1.9%, the same level it was in mid-2019. If the S&P 500 were to return to the same valuation it traded at in mid-2019, it would trade at roughly 25% below its end-of-2021 price.
Such a repricing would likely go some way toward removing the speculative froth of the past two years, but it would still only represent a modest improvement in the yield of the 60/40 portfolio. In order to bring the nominal 60/40 yield up to the level it was at the peak in 1929, which was the lowest portfolio yield prior to the present era, some combination of higher bond yields and lower stock prices would be needed. For example, with a 10-Year Treasury yield near 2.5%, and the S&P 500 trading near 3000, the 60/40 portfolio would offer a combined yield of 3.4% – which was the lowest yield seen in 1929.
It is doubtful most investors are aware of just how precarious today’s market prices are, with inflation rates above 7%. It is also important to remember that the Fed has still been buying mortgage and Treasury bonds in the open market; i.e., market prices are still supported by quantitative easing. We have yet to experience how the markets will react when that monetary support actually ends, but it appears we will find out in the months ahead what such an environment will look like.
* * *
In light of the Russian invasion of Ukraine, the task ahead for the Federal Reserve and other major central banks just became all the more delicate. While it is still too early to assess how markets will respond, beyond initial reactions, it is notable that the price of oil immediately rose to $100 a barrel on Thursday, February 24, 2022. The prices of other commodities rose significantly as well. If the price of commodities were to rise further in the coming months, it would exacerbate the inflation problem the Fed is now desperate to address, in more ways than one.
As Arthur Burns and the Fed officials of the 1970s discovered, a rise in the price of oil in response to geopolitical events not only increases inflation, but it also acts as a tax on the economy, the net proceeds of which flow out of the country to other oil-producing nations. Thus, a rising oil price is an inflationary trend that also acts as a drain on domestic economic growth — i.e., it is stagflationary. A new stagflationary weight on the economy would decrease the Fed’s flexibility in addressing inflation with interest rates without harming economic growth.
Over the past year, the difference between the 2-Year Treasury yield and the 10-Year Treasury yield has declined from 1.58 basis points to just 0.41 basis points, as of Wednesday, February 23rd. This is a remarkable contraction in the yield curve because it has unfolded before the Fed has begun increasing short-term interest rates. Typically, such a contraction in the yield curve unfolds when the Fed is increasing interest rates when the economy is well into its growth cycle.
The yield curve contraction over the past year indicates the bond market views the end of quantitative easing itself as enough of a drag on the economy to dim growth outlook. It also suggests the bond market is already pricing in the end of the Fed’s campaign to increase short-term interest rates, even before it begins. This is uncharted territory for the Fed, as the market may have already begun pricing in the end of a tightening cycle even before the beginning of a rate-hiking campaign.
However, it is not the only uncharted aspect of the current market environment: the resolution of the current negative 5% real yield of a portfolio of U.S. stocks and bonds is, by far, the largest risk facing investors today. The last time investors faced such an unfavorable real yield, in 1947, the valuation of the stock market was less than one-third of its valuation today. With just a 2.3% nominal yield from stocks and bonds, versus a 6.4% nominal yield in 1947, U.S. stocks and bonds have considerable downside risk as the Federal Reserve begins to tighten monetary policy.
An increase in commodity prices due to geopolitical events only serves to increase that risk. There are far higher yields available in markets outside the U.S., and many of those markets have the added benefit of being outside the reach of the coming conflict between the Fed and its Third Great Mistake.
The above is part 2 of Volume I Issue II of The Macro Value Monitor, a publication focusing on Monetary History, Market Myths, Investing Legends, and Real Global Value.
Part I, The Moment When Monetary Policy Runs Aground on the Third Great Mistake, is available on Substack.
The content of this document is provided as general information and is for educational purposes only. It is not intended to provide investment or other advice. This material is not to be construed as a recommendation or solicitation to buy or sell any security, financial product, instrument or to participate in any particular trading strategy. Not all securities, products or services described are available in all countries, and nothing herein constitutes an offer or solicitation of any securities, products or services in any jurisdiction where their offer or sale is not qualified or exempt from registration or otherwise legally permissible.
Although the material herein is based upon information considered reliable and up-to-date, Sitka Pacific Publishing, LLC does not assure that this material is accurate, current, or complete, and it should not be relied upon as such. Content in this document may not be copied, reproduced, republished, or posted, in whole or in part, without prior written consent from Sitka Pacific Publishing, LLC — which is usually gladly given, as long as its use includes clear and proper attribution. Contact us for more information.
© Sitka Pacific Publishing, LLC
The End of Ultra-Low Yields and the Standard 60/40 Portfolio
March 2, 2022
A bedrock of long-term investing, a portfolio split 60/40 between equities and high-quality bonds, posted its worst monthly slide since the market meltdown in the early days of the pandemic. Both equities and bond prices dropped sharply in January as markets priced in a faster pace of interest-rate tightening during 2022 from the Federal Reserve. The central bank’s hawkish pivot from mid-December intensified after last week’s policy meeting, with leading Wall Street economists calling for at least five and possibly as many as seven quarter-point rate hikes this year.
The Bloomberg 60/40 index lost 4.2% in January, reflecting a decline of 5.6% for large cap equities and a loss of 2.2% for the Bloomberg U.S. Aggregate bond index. That’s the worst showing since a slump of 7.7% in March 2020, when pandemic lockdowns plunged the economy into recession.
– Bloomberg, January 31, 2022
For equity markets, rising inflation was already a big concern. Russia’s attack on Ukraine means those worries just got a whole lot bigger. Vladimir Putin’s move to invade his neighbor led to a surge in the price of everything from oil and food to natural gas and aluminum, spikes that could choke economic activity and exacerbate a market rout.
Stocks across the world tumbled on the news, with major benchmarks in both Europe and the U.S. now firmly in correction territory and the Nasdaq 100 index entering a bear market. “The effects of recent events can therefore rightly be described as stagflationary — rising prices with declining economic activity,” said Thomas Boeckelmann, drawing parallels with the malaise that hit equity markets in the 1970s.
– Bloomberg, February 24, 2022
This month marks the anniversary of one of the most significant events of the past decade for investors in U.S. stocks and bonds. When the Covid-19 pandemic began to drag down the financial markets beginning in late February 2020, an unprecedented seismic shift struck the bond market.
In the decade following financial crisis in 2008 and 2009, long-term Treasury bond yields settled into a trading range between 1.5% and 3.5%. This trading range persisted through the beginning and end of successive quantitative easing programs, and also through eight years of near-zero percent short-term interest rates. It also persisted through the Fed’s campaign to increase interest rates and shrink its balance sheet in 2017, 2018 and 2019. It was one of the most durable trends in the post-financial-crisis market landscape.
Yet among the many formerly stable market relationships that changed when the impact of the pandemic hit the economy and financial markets, the most significant for investors was the transition to ultra-low long-term interest rates. The 10-Year Treasury yield fell through the 1.5% floor on February 21st, 2020, then proceeded to decline to as low as 0.398% on March 9th. It was the lowest level ever recorded on the benchmark yield, going back a full century before the end of the last vestiges of the gold standard in 1971.
Most significantly, it remained below its former post-financial-crisis floor throughout the rest of 2020, and all of 2021. Even as inflation rates rose to 7% by the end of last year, the 10-Year Treasury yield remained below 1.5%, and yields throughout the rest of the bond universe remained low as well.
These ultra-low yields were due, in large part, to the Federal Reserve’s decision to backstop corporate and municipal bonds, including the bonds of companies that had been downgraded to junk due to the pandemic. Municipal bonds ended 2021 with an average yield of just above 1%, and AAA-rated corporate bonds yielded just 2.7%. Junk bonds — those at significant risk of default over their duration — offered an average yield of just 3.4%. With such paltry yields from bonds, all of which remained far below the inflation rate, investors and investment managers felt they had no choice but to embrace stocks — even with the broad equity market trading at record valuations.
The cascade of events set in motion from the new era of ultra-low yields in the bond market propelled a buying frenzy in stocks and other risk assets in late 2020 and 2021 as investors scrambled for yield, and the frenzy resulted in the lowest combined yield of a portfolio of U.S. stocks and bonds in history. In July of last year, the cyclically adjusted yield of a traditional 60/40 portfolio fell to 2.13%, the lowest portfolio yield going back to 1881 — lower even than the yields at the speculative peaks in 2000 and 1929. This combined portfolio yield ended 2021 at 2.14%, just one tick above its record low set in July.
The visual history of the yield of the 60/40 portfolio in the chart above reveals that 2021 represented the worst environment in modern history to be invested in U.S. stocks and bonds. When the underlying yield of an investment is near 2%, it takes only a modest uptick in the market’s risk assessment to trigger significant losses.
It turned out that such an uptick in risk assessment began in the first week of this new year, as the market began pricing in a rising Fed Funds rate. As the 13-Week yield began to climb, signaling the market was beginning to expect the Federal Reserve to start raising interest rates within the first quarter, the price of both stocks and bonds began to retreat. By the end of the month, the standard 60/40 portfolio recorded a loss of 4.2%, the largest monthly loss since March 2020, a loss which deepened in February.
Yet while January’s 4.2% loss was the largest monthly decline for the standard 60/40 portfolio in two years, it marked only a modest improvement in the portfolio yield: the nominal yield climbed from 2.14% to 2.31%. A sub-3% yield on a combined 60/40 portfolio is a distinguishing feature of the current bubble in U.S. assets, and it would take much lower asset prices to increase the yield of stocks and bonds to where it was at the peaks in 2000 and 1929. At those speculative peaks, a portfolio of stocks and bonds yielded 3.7% and 3.4% respectively. These yields were 60% and 47% higher than at the end of January.
Since the year-over-year inflation rate climbed in January as well, rising to 7.5% from 7.1% in December, the inflation-adjusted yield of the combined 60/40 fell to a new low, despite the decline in stocks and bonds. At negative 5.17%, the real yield of a portfolio of stocks and bonds ended January at the lowest level since July 1947.
This is a very important dynamic to understand: with the rate of inflation having risen above all expectations over the past year, the real, inflation-adjusted yield of a 60/40 portfolio of U.S. stocks and bonds fell to a new low in January, even though the prices of stocks and bonds declined. In other words, 60/40 portfolio investors endured a 4% loss, but were left holding a portfolio that was more overvalued than it was before. This is the risk embedded in a nominal 2% portfolio yield in an environment of rising inflation.
If the era of ultra-low bond yields is in the process of ending, the sky-high equity market valuations those ultra-low yields fueled over the past two years will likely end as well. The 10-Year Treasury yield is currently at 1.9%, the same level it was in mid-2019. If the S&P 500 were to return to the same valuation it traded at in mid-2019, it would trade at roughly 25% below its end-of-2021 price.
Such a repricing would likely go some way toward removing the speculative froth of the past two years, but it would still only represent a modest improvement in the yield of the 60/40 portfolio. In order to bring the nominal 60/40 yield up to the level it was at the peak in 1929, which was the lowest portfolio yield prior to the present era, some combination of higher bond yields and lower stock prices would be needed. For example, with a 10-Year Treasury yield near 2.5%, and the S&P 500 trading near 3000, the 60/40 portfolio would offer a combined yield of 3.4% – which was the lowest yield seen in 1929.
It is doubtful most investors are aware of just how precarious today’s market prices are, with inflation rates above 7%. It is also important to remember that the Fed has still been buying mortgage and Treasury bonds in the open market; i.e., market prices are still supported by quantitative easing. We have yet to experience how the markets will react when that monetary support actually ends, but it appears we will find out in the months ahead what such an environment will look like.
* * *
In light of the Russian invasion of Ukraine, the task ahead for the Federal Reserve and other major central banks just became all the more delicate. While it is still too early to assess how markets will respond, beyond initial reactions, it is notable that the price of oil immediately rose to $100 a barrel on Thursday, February 24, 2022. The prices of other commodities rose significantly as well. If the price of commodities were to rise further in the coming months, it would exacerbate the inflation problem the Fed is now desperate to address, in more ways than one.
As Arthur Burns and the Fed officials of the 1970s discovered, a rise in the price of oil in response to geopolitical events not only increases inflation, but it also acts as a tax on the economy, the net proceeds of which flow out of the country to other oil-producing nations. Thus, a rising oil price is an inflationary trend that also acts as a drain on domestic economic growth — i.e., it is stagflationary. A new stagflationary weight on the economy would decrease the Fed’s flexibility in addressing inflation with interest rates without harming economic growth.
Over the past year, the difference between the 2-Year Treasury yield and the 10-Year Treasury yield has declined from 1.58 basis points to just 0.41 basis points, as of Wednesday, February 23rd. This is a remarkable contraction in the yield curve because it has unfolded before the Fed has begun increasing short-term interest rates. Typically, such a contraction in the yield curve unfolds when the Fed is increasing interest rates when the economy is well into its growth cycle.
The yield curve contraction over the past year indicates the bond market views the end of quantitative easing itself as enough of a drag on the economy to dim growth outlook. It also suggests the bond market is already pricing in the end of the Fed’s campaign to increase short-term interest rates, even before it begins. This is uncharted territory for the Fed, as the market may have already begun pricing in the end of a tightening cycle even before the beginning of a rate-hiking campaign.
However, it is not the only uncharted aspect of the current market environment: the resolution of the current negative 5% real yield of a portfolio of U.S. stocks and bonds is, by far, the largest risk facing investors today. The last time investors faced such an unfavorable real yield, in 1947, the valuation of the stock market was less than one-third of its valuation today. With just a 2.3% nominal yield from stocks and bonds, versus a 6.4% nominal yield in 1947, U.S. stocks and bonds have considerable downside risk as the Federal Reserve begins to tighten monetary policy.
An increase in commodity prices due to geopolitical events only serves to increase that risk. There are far higher yields available in markets outside the U.S., and many of those markets have the added benefit of being outside the reach of the coming conflict between the Fed and its Third Great Mistake.
The above is part 2 of Volume I Issue II of The Macro Value Monitor, a publication focusing on Monetary History, Market Myths, Investing Legends, and Real Global Value.
Part I, The Moment When Monetary Policy Runs Aground on the Third Great Mistake, is available on Substack.
The content of this document is provided as general information and is for educational purposes only. It is not intended to provide investment or other advice. This material is not to be construed as a recommendation or solicitation to buy or sell any security, financial product, instrument or to participate in any particular trading strategy. Not all securities, products or services described are available in all countries, and nothing herein constitutes an offer or solicitation of any securities, products or services in any jurisdiction where their offer or sale is not qualified or exempt from registration or otherwise legally permissible.
Although the material herein is based upon information considered reliable and up-to-date, Sitka Pacific Publishing, LLC does not assure that this material is accurate, current, or complete, and it should not be relied upon as such. Content in this document may not be copied, reproduced, republished, or posted, in whole or in part, without prior written consent from Sitka Pacific Publishing, LLC — which is usually gladly given, as long as its use includes clear and proper attribution. Contact us for more information.
© Sitka Pacific Publishing, LLC
Investment Management
Before investing, we will discuss your goals and risk tolerances with you to see if a separately managed account at Sitka Pacific would be a good fit. To contact us for a free consultation, visit Getting Started.
Macro Value Monitor
To read a selection of recent client letters and be alerted when new letters are posted to our public site, visit Recent Client Letters.