
Investment Management
Macro Value Monitor

On Braking Distances and a Record Price for Pet Rocks
2nd Quarter, 2024
Gold extended its rally to a fresh record high after a key US jobs report bolstered expectations that the Federal Reserve will soon cut interest rates. The precious metal climbed as much as 1.2% to $2,185.50 an ounce, rising for an eighth straight day in an advance that has been fueled by hopes for rate cuts, central bank buying and renewed investor interest.
Yet the scale and speed of the recent ascent has caught many seasoned market observers off-guard, with no clear catalyst for the rally beyond long-standing pillars of support…
~ Bloomberg, March 8, 2024
Capitalism cannot thrive with a negative curve. It cannot forever provide a Treasury with a higher yield and a shorter duration.
~ Bill Gross, February 28, 2024

The Infamous Pet Rock
This month marks the 21st month of inversion in the Treasury yield curve, a duration which gives in the distinction of being longest-lasting yield curve inversion of the post-war era. Not since the Fed-Treasury Accord of 1951 restored normal functioning in the bond market after World War II has there been a longer period when the market’s time preference favored short-term lending rates that are higher than long term yields.
What this lengthy inversion says, and does not say, about the prospects for the economy and the financial markets has been the subject of intense debate over the past year.
Throughout the four decades leading up to 2022, an inversion of the Treasury yield curve provided a stark warning that interest rates and yields were poised to decline precipitously. With lone the exception of the turmoil caused by the Asian financial crisis in 1998, such a prediction from the bond market between 1982 and 2021 stemmed from a single underlying source: a looming recession.
Yield curve inversions during those years tended to be brief; sometimes, they lasted only a few months. In addition, the equity bear markets following them tended to be severe. The yield curve inversions in 2006 and 2000 were followed by bear markets which cut the value of large-cap U.S. stocks in half. Though influenced by the pandemic, the yield curve inversion in 2019 was followed by a 35% plunge in March 2020. And the inversion in 1989, though only lasting three months, was followed by a swift 20% decline in 1990.
These experiences conditioned several generations of economists and investment managers to be on high alert for volatility, falling interest rates, and risk asset declines when the yield curve inverted, no matter how fleeting the inversion was. Even the brief 2-month inversion in 1998, which was not followed by a recession in the U.S., was nonetheless followed by a 22% decline in the S&P 500 as the Asian financial crisis spread.
Experiences such as these impressed the lesson that, regardless of whether inversions were followed by conditions which met the technical definition of a recession, the market outcomes were potent and consistent. To ignore these bond market signals was to expose oneself to significant risk, as well as lost opportunities to invest at more favorable valuations.
Yet it has not always been the case that yield curve inversions have been so brief. While the signals between 1980-2020 were relatively short, yield curve inversions in the two decades prior to that era were quite different. These earlier inversions in the 1960s, 1970s, and early 1980s reflected a fundamentally different economic environment – a more inflationary environment.
One thing these earlier yield curve inversions had in common was their duration – they lasted a long time. In becoming the longest in the post-war era this past month, the current yield curve inversion dethroned the prior record holder, which lasted twenty-one months from September 1980 to July 1982. Closely behind that was the yield curve inversion from August 1978 to April 1980, which lasted twenty months. These extended bond market signals preceded the recessions in 1980 and 1981-82.
Another extended yield curve inversion accompanied the deep recession in 1973-74. These recessions during the Great Inflation of 1970s and early 1980s are highlighted in red in the chart below:
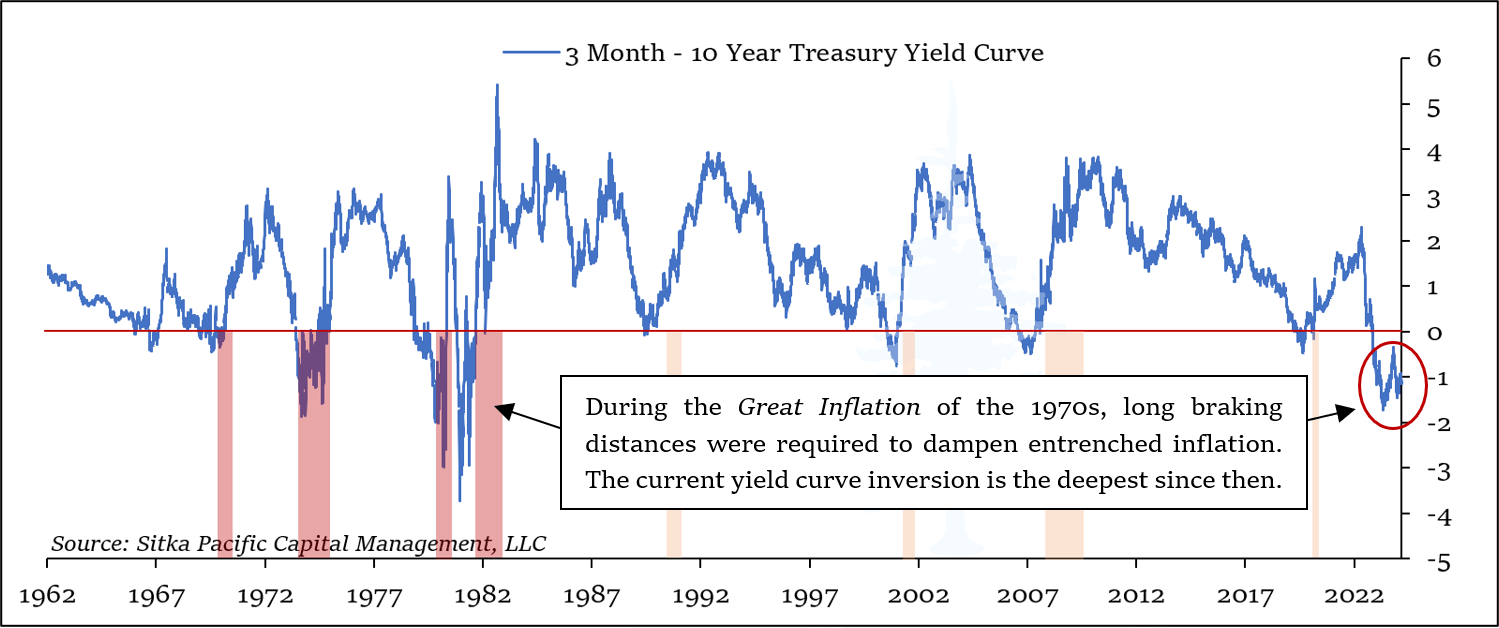
The yield curve inversions of the 1970s and early 1980s also had another thing in common, aside from their extended durations – they were deep. As you can see in the chart above, the inversions of the 1970s and 1980s regularly plunged far below the zero line, reaching as low as -4% in the early 1980s. Such large differences between long-term yields and short-term interest rates are in stark contrast to the inversions after the early 1980s, all of which were relatively brief and shallow.
In light of these commonalities, one message that can be drawn from the current yield curve inversion is this: its depth and extended duration are signs of entrenched inflation.
We can use yet another automobile-themed metaphor to visualize why this is the case, as we did last quarter with The Salient Views in the Rearview Mirror.
Quite simply, an inverted yield curve is akin to stepping on the monetary brakes. Banks and other lending institutions generally “borrow short, and lend long,” meaning that they take short-term money – such as cash held in checking and savings accounts, as well as other similarly short-term deposits – and turn around and make long-term loans – such as construction loans, credit lines, and real estate mortgages. The incentive to make long-term loans resides in the difference between the interest paid on the short-term deposits versus the rates received on long-term loans. When there is a large, positive difference between long-term yields and short-term rates, there is a large incentive for banks and other lending institutions to lend. This positive incentive expands credit, which in turn stimulates the economy.
When short-term rates rise above long-term rates, however, the incentive to make long-term loans evaporates and turns into a disincentive. This disincentive, in turn, acts as a brake on credit creation – and a brake on the economy.
How well this credit-induced braking works depends on other factors, such as how much prices and economic growth are being fueled by credit and lending growth versus base money supply growth. During the Great Inflation, prices and GDP growth were being fueled by base money supply growth, and as a result, the credit-brake provided by an inverted yield curve required long braking distances to slow inflation. In the four decades after 1982, prices and GDP growth were fueled more by credit growth. During those years all the Federal Reserve had to do was tap the brakes with a modest increase of short-term rates over long-term rates, and inflation and GDP growth stopped on a dime.
Thus, how long it takes for an inverted yield curve to bring the economy to a stop gives a strong hint as to what is fueling prices and GDP growth. Long braking distances, as was the case during the 1970s and early 1980s, tell us that rising prices are largely being fueled by base money supply growth. They also tell us inflation today is more firmly entrenched than at any other time since the Great Inflation.
* * *
In 2021, stocks, bonds, and real estate in the U.S. simultaneously reached the highest valuations on record. This valuation Trifecta, as Dr. Robert Shiller called it, represented an acute dilemma. As inflation pivoted higher, these three asset classes had the lowest yields on record, which meant they were uniquely vulnerable to being devalued if higher inflation were to drive yields higher.
Since 2021, that is precisely what has happened: bond yields have risen, equity valuations (shown below) have fallen, and as a result, the total return of a U.S. 60/40 portfolio has been near zero.

During that same period, starting when we reviewed the story of John Law in January 2022, the price of gold has risen at a 9% annualized rate. Most of that rise has been quiet, but last month gold suddenly surged to a new record high in dramatic fashion. In early April, gold continued to climb, recently reaching as high as $2400.
As the quote at the beginning of this discussion highlighted, the speed and scale of the recent rally appears to have caught many by surprise, as many of the traditional indicators used to gauge the likelihood of a rise in the price in gold have lately been pointing in the other direction.
For example, inflation-adjusted interest rates have risen back into positive territory over the past year, after being deeply negative in 2021 and 2022. Also, the U.S. dollar, while still down from its peak in 2022, has remained stronger than expected over the past year, especially over the past few months. In recent weeks, the Federal Reserve has dialed back expectations for rate cuts this year in response to stronger-than-expected readings on inflation, and this has resulted in rising yields in the bond market, and a rising dollar – conditions which should have represented strong headwinds for gold.
Yet gold has often defied conventional expectations of its short-term price movements, as well as traditional views of its long-term value. These misunderstandings can result in price moves with “no clear catalyst” at times. It also leads many thoughtful investors and commentators to dismiss gold’s investment value entirely – despite its 8% annualized return over the past half century.
In July 2015, the widely read Wall Street Journal columnist, Intelligent Investor editor, and general value-investing proponent Jason Zweig penned an article entitled Let’s Be Honest About Gold: It’s a Pet Rock.
In it, many of the misconceptions about gold that have remained firmly entrenched for over the past fifty years were cited: it is impossible to value, because it generates no earnings; it doesn’t always “go up” during hard times; and it is “cumbersome and archaic and barbaric.” The article ended by mentioning that since gold represented only 1.3% of the world’s financial assets, holding much more than that in your portfolio was “an act of faith.” It was a typically harsh assessment from the traditional value perspective.
A year later, Mr. Zweig published a follow-up article: Gold: It’s Still a Pet Rock. In the year since the article in 2015 was published, gold’s price had risen 20% from its lows, and Zweig sounded somewhat defensive:
“While gold is a reliable store of value over extremely long periods, most investors don’t lock their money up for a couple thousand years at a time. In the shorter term, gold fluctuates so wildly that it is a surprisingly poor hedge against increases in the cost of living.
…gold is a partial, not a perfect, hedge against chaos. In October 2008, for instance, when U.S. stocks fell 16.8% and corporate bonds lost 4.5%, gold dropped 18.5%; in September 2011, as U.S. stocks fell 7% and corporate bonds gained 1%, gold dropped 11.4%. In October 2008, the depths of the global financial crisis, the gold price was 30% lower than it is now. In August 2011, when Standard & Poor’s downgraded the U.S.’s credit rating, gold was nearly 40% higher than it is now.
Is today’s chaos that much worse than the financial crisis? Was the summer of 2011 so much darker than today?…The future can always be different from the past. But if gold shoots far up from here, it won’t be following the precedents of the past. It will be violating them.”
It is not without irony that since those articles were published, gold has advanced at a 9% annualized rate, almost perfectly in line with its long-term return of 8% since 1970. Instead of violating the precedents of the past by shooting up from there, gold affirmed them.
What is so often missed in traditional assessments is that gold is not a financial asset, like a stock, or a bond – it is the basis of a sound currency. As such, it is not supposed to have earnings, or a yield. It is supposed to be a monetary store of value over time, doing nothing else but sitting quietly, without any fanfare, or counter-party risk…just like a pet rock.
Since currencies are no longer valued with a fixed exchange rate in gold, gold’s long-term value is now weighted in the markets by the amount of money circulating world-wide. And because it is actively traded in the financial markets, its price fluctuates around that value due to a myriad of ephemeral factors, including market liquidity, monetary and fiscal policy changes, and its cycles of popularity with investors – including central banks.
For example, the infamous Brown Bottom marked a simultaneous low in gold’s price in the 1990s and 2000s, and its stature at the Bank of England. More recently, The People’s Bank of China has been increasing its purchases, as gold’s standing there has increased.
Amid the noisy fluctuations of its price, gold’s long-term value has reliably kept pace with the growth of various measures of money – just as it should. The growth rates in various measures of the money supply over the past half century – M1, M2, Currency (in circulation), and the Fed’s Monetary Base – are all similar to gold’s 8% long-term return. In this way, gold continues to fulfill its role as a reliable store of value, not only over thousands of years, but also over periods of time relevant to investors today.
The new record comes as estimates of the future value of money are again being revised amidst the Treasury yield curve inversion. As you can see by the green shading in the chart below, yield curve inversions have consistently ushered in periods of strong gold price appreciation, and in this context gold’s advance is not surprising; it is simply looking beyond short-term headwinds.

Over the past year, it was widely expected the economy would be in recession by the first or second quarter of this year. As we discussed last year, the New York Federal Reserve’s recession model forecasted a high probability the economy would be in recession by this spring. This recession forecast was based largely on the experiences of the brief yield curve inversions over the past four decades, which don’t fully reflect the long braking distance needed when inflation is more entrenched. Not since the Great Inflation has it taken this long to slow down inflation.
As a result, with prices rising at nearly double the Federal Reserve’s long-term target rate, it remains to be seen whether a recession will be needed to bring inflation down to 2%, or whether the Fed – and the country – will begin to tolerate higher inflation rates. It also remains to be seen what future Federal budget deficits will look like following the current inflation battle, and how high yields will go. Over the past quarter, long-term Treasury bond yields have drifted higher again as rate cut expectations have faded, forcing mortgage rates and other lending rates back up toward their highs of last year.
As yields have risen, there has been a notable sentiment shift away from the assumption that rates and yields will return to the lower levels that existed prior to 2022 anytime soon. This assumption has been a key support for elevated valuations in the U.S., and its potential erosion represents one of the key risks for U.S. risk assets.
Outside U.S. stocks and bonds, valuations are more modest, as are risks. Thus, diversification will likely continue to add to returns in the years ahead, helping to keep portfolios running relatively smoothly even if the U.S equity market sputters, stalls, and continues its reversion from the record high valuation in 2021.
* * *
The preceding is part of our 2nd Quarter letter to clients, which they received in April. To request a copy of the letter, or to request a complimentary consultation to review your investments, visit Getting Started.
The content of this article is provided as general information and is for educational purposes only. It is not intended to provide investment or other advice. This material is not to be construed as a recommendation or solicitation to buy or sell any security, financial product, instrument or to participate in any particular trading strategy. Not all securities, products or services described are available in all countries, and nothing herein constitutes an offer or solicitation of any securities, products or services in any jurisdiction where their offer or sale is not qualified or exempt from registration or otherwise legally permissible.
Although the material herein is based upon information considered reliable and up-to-date, Sitka Pacific Capital Management, LLC does not assure that this material is accurate, current, or complete, and it should not be relied upon as such. Content in this document may not be copied, reproduced, republished, or posted, in whole or in part, without prior written consent — which is usually gladly given, as long as its use includes clear and proper attribution. Contact us for more information.
© Sitka Pacific Capital Management, LLC
On Braking Distances and a Record Price for Pet Rocks
2nd Quarter, 2024
Gold extended its rally to a fresh record high after a key US jobs report bolstered expectations that the Federal Reserve will soon cut interest rates. The precious metal climbed as much as 1.2% to $2,185.50 an ounce, rising for an eighth straight day in an advance that has been fueled by hopes for rate cuts, central bank buying and renewed investor interest.
Yet the scale and speed of the recent ascent has caught many seasoned market observers off-guard, with no clear catalyst for the rally beyond long-standing pillars of support…
~ Bloomberg, March 8, 2024
Capitalism cannot thrive with a negative curve. It cannot forever provide a Treasury with a higher yield and a shorter duration.
~ Bill Gross, February 28, 2024
The Infamous Pet Rock
This month marks the 21st month of inversion in the Treasury yield curve, a duration which gives in the distinction of being longest-lasting yield curve inversion of the post-war era. Not since the Fed-Treasury Accord of 1951 restored normal functioning in the bond market after World War II has there been a longer period when the market’s time preference favored short-term lending rates that are higher than long term yields.
What this lengthy inversion says, and does not say, about the prospects for the economy and the financial markets has been the subject of intense debate over the past year.
Throughout the four decades leading up to 2022, an inversion of the Treasury yield curve provided a stark warning that interest rates and yields were poised to decline precipitously. With lone the exception of the turmoil caused by the Asian financial crisis in 1998, such a prediction from the bond market between 1982 and 2021 stemmed from a single underlying source: a looming recession.
Yield curve inversions during those years tended to be brief; sometimes, they lasted only a few months. In addition, the equity bear markets following them tended to be severe. The yield curve inversions in 2006 and 2000 were followed by bear markets which cut the value of large-cap U.S. stocks in half. Though influenced by the pandemic, the yield curve inversion in 2019 was followed by a 35% plunge in March 2020. And the inversion in 1989, though only lasting three months, was followed by a swift 20% decline in 1990.
These experiences conditioned several generations of economists and investment managers to be on high alert for volatility, falling interest rates, and risk asset declines when the yield curve inverted, no matter how fleeting the inversion was. Even the brief 2-month inversion in 1998, which was not followed by a recession in the U.S., was nonetheless followed by a 22% decline in the S&P 500 as the Asian financial crisis spread.
Experiences such as these impressed the lesson that, regardless of whether inversions were followed by conditions which met the technical definition of a recession, the market outcomes were potent and consistent. To ignore these bond market signals was to expose oneself to significant risk, as well as lost opportunities to invest at more favorable valuations.
Yet it has not always been the case that yield curve inversions have been so brief. While the signals between 1980-2020 were relatively short, yield curve inversions in the two decades prior to that era were quite different. These earlier inversions in the 1960s, 1970s, and early 1980s reflected a fundamentally different economic environment – a more inflationary environment.
One thing these earlier yield curve inversions had in common was their duration – they lasted a long time. In becoming the longest in the post-war era this past month, the current yield curve inversion dethroned the prior record holder, which lasted twenty-one months from September 1980 to July 1982. Closely behind that was the yield curve inversion from August 1978 to April 1980, which lasted twenty months. These extended bond market signals preceded the recessions in 1980 and 1981-82.
Another extended yield curve inversion accompanied the deep recession in 1973-74. These recessions during the Great Inflation of 1970s and early 1980s are highlighted in red in the chart below:
The yield curve inversions of the 1970s and early 1980s also had another thing in common, aside from their extended durations – they were deep. As you can see in the chart above, the inversions of the 1970s and 1980s regularly plunged far below the zero line, reaching as low as -4% in the early 1980s. Such large differences between long-term yields and short-term interest rates are in stark contrast to the inversions after the early 1980s, all of which were relatively brief and shallow.
In light of these commonalities, one message that can be drawn from the current yield curve inversion is this: its depth and extended duration are signs of entrenched inflation.
We can use yet another automobile-themed metaphor to visualize why this is the case, as we did last quarter with The Salient Views in the Rearview Mirror.
Quite simply, an inverted yield curve is akin to stepping on the monetary brakes. Banks and other lending institutions generally “borrow short, and lend long,” meaning that they take short-term money – such as cash held in checking and savings accounts, as well as other similarly short-term deposits – and turn around and make long-term loans – such as construction loans, credit lines, and real estate mortgages. The incentive to make long-term loans resides in the difference between the interest paid on the short-term deposits versus the rates received on long-term loans. When there is a large, positive difference between long-term yields and short-term rates, there is a large incentive for banks and other lending institutions to lend. This positive incentive expands credit, which in turn stimulates the economy.
When short-term rates rise above long-term rates, however, the incentive to make long-term loans evaporates and turns into a disincentive. This disincentive, in turn, acts as a brake on credit creation – and a brake on the economy.
How well this credit-induced braking works depends on other factors, such as how much prices and economic growth are being fueled by credit and lending growth versus base money supply growth. During the Great Inflation, prices and GDP growth were being fueled by base money supply growth, and as a result, the credit-brake provided by an inverted yield curve required long braking distances to slow inflation. In the four decades after 1982, prices and GDP growth were fueled more by credit growth. During those years all the Federal Reserve had to do was tap the brakes with a modest increase of short-term rates over long-term rates, and inflation and GDP growth stopped on a dime.
Thus, how long it takes for an inverted yield curve to bring the economy to a stop gives a strong hint as to what is fueling prices and GDP growth. Long braking distances, as was the case during the 1970s and early 1980s, tell us that rising prices are largely being fueled by base money supply growth. They also tell us inflation today is more firmly entrenched than at any other time since the Great Inflation.
* * *
In 2021, stocks, bonds, and real estate in the U.S. simultaneously reached the highest valuations on record. This valuation Trifecta, as Dr. Robert Shiller called it, represented an acute dilemma. As inflation pivoted higher, these three asset classes had the lowest yields on record, which meant they were uniquely vulnerable to being devalued if higher inflation were to drive yields higher.
Since 2021, that is precisely what has happened: bond yields have risen, equity valuations (shown below) have fallen, and as a result, the total return of a U.S. 60/40 portfolio has been near zero.
During that same period, starting when we reviewed the story of John Law in January 2022, the price of gold has risen at a 9% annualized rate. Most of that rise has been quiet, but last month gold suddenly surged to a new record high in dramatic fashion. In early April, gold continued to climb, recently reaching as high as $2400.
As the quote at the beginning of this discussion highlighted, the speed and scale of the recent rally appears to have caught many by surprise, as many of the traditional indicators used to gauge the likelihood of a rise in the price in gold have lately been pointing in the other direction.
For example, inflation-adjusted interest rates have risen back into positive territory over the past year, after being deeply negative in 2021 and 2022. Also, the U.S. dollar, while still down from its peak in 2022, has remained stronger than expected over the past year, especially over the past few months. In recent weeks, the Federal Reserve has dialed back expectations for rate cuts this year in response to stronger-than-expected readings on inflation, and this has resulted in rising yields in the bond market, and a rising dollar – conditions which should have represented strong headwinds for gold.
Yet gold has often defied conventional expectations of its short-term price movements, as well as traditional views of its long-term value. These misunderstandings can result in price moves with “no clear catalyst” at times. It also leads many thoughtful investors and commentators to dismiss gold’s investment value entirely – despite its 8% annualized return over the past half century.
In July 2015, the widely read Wall Street Journal columnist, Intelligent Investor editor, and general value-investing proponent Jason Zweig penned an article entitled Let’s Be Honest About Gold: It’s a Pet Rock.
In it, many of the misconceptions about gold that have remained firmly entrenched for over the past fifty years were cited: it is impossible to value, because it generates no earnings; it doesn’t always “go up” during hard times; and it is “cumbersome and archaic and barbaric.” The article ended by mentioning that since gold represented only 1.3% of the world’s financial assets, holding much more than that in your portfolio was “an act of faith.” It was a typically harsh assessment from the traditional value perspective.
A year later, Mr. Zweig published a follow-up article: Gold: It’s Still a Pet Rock. In the year since the article in 2015 was published, gold’s price had risen 20% from its lows, and Zweig sounded somewhat defensive:
“While gold is a reliable store of value over extremely long periods, most investors don’t lock their money up for a couple thousand years at a time. In the shorter term, gold fluctuates so wildly that it is a surprisingly poor hedge against increases in the cost of living.
…gold is a partial, not a perfect, hedge against chaos. In October 2008, for instance, when U.S. stocks fell 16.8% and corporate bonds lost 4.5%, gold dropped 18.5%; in September 2011, as U.S. stocks fell 7% and corporate bonds gained 1%, gold dropped 11.4%. In October 2008, the depths of the global financial crisis, the gold price was 30% lower than it is now. In August 2011, when Standard & Poor’s downgraded the U.S.’s credit rating, gold was nearly 40% higher than it is now.
Is today’s chaos that much worse than the financial crisis? Was the summer of 2011 so much darker than today?…The future can always be different from the past. But if gold shoots far up from here, it won’t be following the precedents of the past. It will be violating them.”
It is not without irony that since those articles were published, gold has advanced at a 9% annualized rate, almost perfectly in line with its long-term return of 8% since 1970. Instead of violating the precedents of the past by shooting up from there, gold affirmed them.
What is so often missed in traditional assessments is that gold is not a financial asset, like a stock, or a bond – it is the basis of a sound currency. As such, it is not supposed to have earnings, or a yield. It is supposed to be a monetary store of value over time, doing nothing else but sitting quietly, without any fanfare, or counter-party risk…just like a pet rock.
Since currencies are no longer valued with a fixed exchange rate in gold, gold’s long-term value is now weighted in the markets by the amount of money circulating world-wide. And because it is actively traded in the financial markets, its price fluctuates around that value due to a myriad of ephemeral factors, including market liquidity, monetary and fiscal policy changes, and its cycles of popularity with investors – including central banks.
For example, the infamous Brown Bottom marked a simultaneous low in gold’s price in the 1990s and 2000s, and its stature at the Bank of England. More recently, The People’s Bank of China has been increasing its purchases, as gold’s standing there has increased.
Amid the noisy fluctuations of its price, gold’s long-term value has reliably kept pace with the growth of various measures of money – just as it should. The growth rates in various measures of the money supply over the past half century – M1, M2, Currency (in circulation), and the Fed’s Monetary Base – are all similar to gold’s 8% long-term return. In this way, gold continues to fulfill its role as a reliable store of value, not only over thousands of years, but also over periods of time relevant to investors today.
The new record comes as estimates of the future value of money are again being revised amidst the Treasury yield curve inversion. As you can see by the green shading in the chart below, yield curve inversions have consistently ushered in periods of strong gold price appreciation, and in this context gold’s advance is not surprising; it is simply looking beyond short-term headwinds.
Over the past year, it was widely expected the economy would be in recession by the first or second quarter of this year. As we discussed last year, the New York Federal Reserve’s recession model forecasted a high probability the economy would be in recession by this spring. This recession forecast was based largely on the experiences of the brief yield curve inversions over the past four decades, which don’t fully reflect the long braking distance needed when inflation is more entrenched. Not since the Great Inflation has it taken this long to slow down inflation.
As a result, with prices rising at nearly double the Federal Reserve’s long-term target rate, it remains to be seen whether a recession will be needed to bring inflation down to 2%, or whether the Fed – and the country – will begin to tolerate higher inflation rates. It also remains to be seen what future Federal budget deficits will look like following the current inflation battle, and how high yields will go. Over the past quarter, long-term Treasury bond yields have drifted higher again as rate cut expectations have faded, forcing mortgage rates and other lending rates back up toward their highs of last year.
As yields have risen, there has been a notable sentiment shift away from the assumption that rates and yields will return to the lower levels that existed prior to 2022 anytime soon. This assumption has been a key support for elevated valuations in the U.S., and its potential erosion represents one of the key risks for U.S. risk assets.
Outside U.S. stocks and bonds, valuations are more modest, as are risks. Thus, diversification will likely continue to add to returns in the years ahead, helping to keep portfolios running relatively smoothly even if the U.S equity market sputters, stalls, and continues its reversion from the record high valuation in 2021.
* * *
The preceding is part of our 2nd Quarter letter to clients, which they received in April. To request a copy of the letter, or to request a complimentary consultation to review your investments, visit Getting Started.
The content of this article is provided as general information and is for educational purposes only. It is not intended to provide investment or other advice. This material is not to be construed as a recommendation or solicitation to buy or sell any security, financial product, instrument or to participate in any particular trading strategy. Not all securities, products or services described are available in all countries, and nothing herein constitutes an offer or solicitation of any securities, products or services in any jurisdiction where their offer or sale is not qualified or exempt from registration or otherwise legally permissible.
Although the material herein is based upon information considered reliable and up-to-date, Sitka Pacific Capital Management, LLC does not assure that this material is accurate, current, or complete, and it should not be relied upon as such. Content in this document may not be copied, reproduced, republished, or posted, in whole or in part, without prior written consent — which is usually gladly given, as long as its use includes clear and proper attribution. Contact us for more information.
© Sitka Pacific Capital Management, LLC
Investment Management
Before investing, we will discuss your goals and risk tolerances with you to see if a separately managed account at Sitka Pacific would be a good fit. To contact us for a free consultation, visit Getting Started.
Macro Value Monitor
To read a selection of recent client letters and be alerted when new letters are posted to our public site, visit Recent Client Letters.