
Investment Management
Macro Value Monitor

Shiller’s ECY Makes Relative Sense, but the Market’s Absolute Return May Be Another Story
By Brian McAuley
April 22, 2021
We cannot know how the COVID-19 pandemic will end, and it may well end soon with the advent of effective vaccines. But a key takeaway of the ECY indicator is that it confirms the relative attractiveness of equities, particularly given a potentially protracted period of low interest rates. It may justify the FOMO narrative and go some way toward explaining the strong investor preference for equities since March.
Eventually, down the line, bond yields may just rise, and equity valuations may also have to reset alongside yields. But, at this point, despite the risks and the high CAPE ratios, stock-market valuations may not be as absurd as some people think.
– Robert Shiller, Making Sense of Sky-High Stock Prices, November 2020
It often happens that associations which end up leaving an indelible mark on our collective memory of certain market events are the result of sheer happenstance. One instance of this is our association of the phrase irrational exuberance with the peak of the tech bubble twenty-one years ago. The phrase is most widely associated with Yale professor Robert Shiller, whose book titled Irrational Exuberance happened to be published in March 2000 — the very month that marked the peak of the tech bubble. If there was a single moment in the last few decades which defined irrational exuberance in the stock market more than any other, it was the frenzied buying in those last weeks leading up to the March 2000 peak. From that moment, irrational exuberance entered our cultural lexicon as the definition of the bubble experience, and it has been there ever since.
If the book Irrational Exuberance had been published a year earlier, or a year later, the phrase probably would not have the same legacy, as Shiller was not the first person to publicly cite irrational exuberance during that period. Fed Chairman Alan Greenspan used it in congressional testimony to describe the conundrum facing policy makers in judging the value of the stock market in 1996. In hindsight, 1996 happened to be the year which marked the beginning of the tech bubble’s speculative frenzy, and if not for Shiller’s book, irrational exuberance may have had a different legacy; perhaps a phrase marking the beginning of a bubble, not the end. As it happens, Greenspan’s use of irrational exuberance marked the moment of liftoff of the tech bubble, while Shiller’s book marked the moment it came to a crashing end. Those two uses of the same phrase neatly bookended the most speculative period in stock market history.
While the precise timing of the publication of Irrational Exuberance in March of 2000 may have been random chance, Shiller proved in subsequent years that his analysis was not the result of happenstance. The appearance of the first edition of Irrational Exuberance marked the peak of the tech bubble within a month, and the second edition of the book was published in 2005 — and it included a detailed discussion of the housing bubble. Within a year of the publication of the second edition, home prices in the U.S. reached their peak, and in the years that followed, investors endured the bursting of the second major market bubble within a decade.
It is not an extremely complicated task to look at a market’s valuation and assess whether it is likely overvalued, but it is nearly impossible to know just when an overvalued market will stop becoming even more overvalued, and begin to deflate. Yet with the first two editions of Irrational Exuberance, Robert Shiller managed to do the nearly impossible — twice. As a point of fact, however, Chairman Greenspan’s assessment of the market’s overvaluation in 1996 proved not entirely off the mark. While Shiller’s book marked the precise moment the bubble popped, Greenspan’s assessment happened to be made early in what turned out to be the largest market bubble since 1929. In the end, all the of gains made subsequent to his testimony proved to be temporary, which showed that his basic assessment was correct; the S&P 500 traded at the same level in 2003, and again 2009, as it did when he testified before Congress in December 1996. The ephemeral nature of gains is a hallmark of an overvalued market, as is the difficulty in precisely timing the deflation of those short-lived gains.
The third edition of Irrational Exuberance, however, showed that even Robert Shiller was not immune from the inherent difficulty of timing an overvalued market. Published in 2015, in the third edition Shiller turned his attention to bonds, commenting that holding bonds at the low rates which existed at the time was not likely to end well for investors. Although he did not call it a speculative bubble, and thought bond yields could well remain low for a while longer, he also thought having long-term bond yields near the long-term rate of inflation — or below — was clearly unsustainable.
Six years later, we now know that not only can long-term bond yields remain low, they can sink to levels which were nearly unimaginable just a few years ago. At the time of the publication of the third edition of Irrational Exuberance, the 10-Year Treasury yield was fluctuating between 2% and 2.5%. Since then, the 10-Year Treasury yield has sunk to as low as 0.4%, and major benchmark yields outside the U.S., such as in Japan and Germany, have fallen below zero.
It is difficult to understate the impact the continued trend lower in long-term interest rates since 2015 has had on risk asset valuations, especially over the past year. When long-term “risk-free” rates fall to near zero, as in the case of the U.S. in 2020, or below zero, as continues to be the case in Japan and Germany, the higher yield received from other assets becomes all the more sought after. And when those long-term rates are below the expected rate of inflation, yields which remain above the rate of inflation are highly valued.
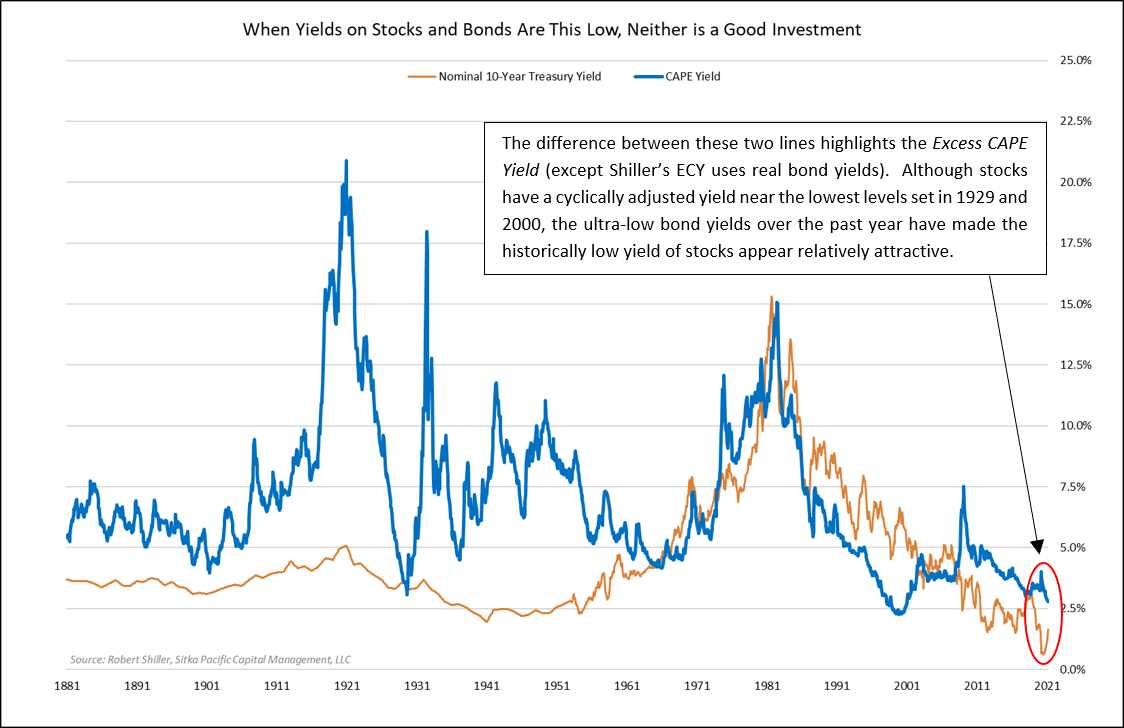
To better visualize this dynamic between low risk-free yields and the valuation of the stock market, Shiller released a new indicator last fall: the ECY, or the Excess CAPE Yield. The value of the ECY for the S&P 500 is calculated by taking the cyclically adjusted earnings yield (using the average earnings over the last ten years) and subtracting the real, inflation-adjusted 10-Year Treasury yield. The result is the excess real yield investors receive by owning the S&P 500 instead of 10-Year Treasury notes.

Yet choosing the “least bad” investment option does not guarantee it will lead to a positive absolute return. The overall return investors receive from publicly traded stocks is not simply the earnings of the underlying corporations — it is also a function of the value at which those earnings trade.Within the realm of institutional asset management, which is largely confined to assessing the relative attractiveness of stocks, bonds and cash equivalents, the blue line in the chart above showing the Excess CAPE Yield represents the best option among the three. With interest rates at zero, cash equivalents represent a near-certain inflation-adjusted loss in the years ahead. Long-term Treasury yields are also below the expected rate of inflation, and the rise in long-term rates this year highlights the added risk of these supposedly risk-free securities in the face of rising inflation expectations. Investment grade corporate bonds have also had a negative return this year. Amidst these poor cash and bond options, the positive excess earnings yield received by owning stocks seems to be the only real alternative when investment options are restricted to U.S. stocks, bonds, and cash.
The earnings yield of the S&P 500 is a combined measure of the earnings of the underlying companies and the valuation at which investors are currently willing to trade partial claims to those earnings. The absolute return that investors realize from owning stocks depends significantly on how the valuation of underlying corporate earnings changes, especially over the time horizons relevant to most investors — i.e., holding periods less than 15–20 years. If the market’s valuation of earnings rises, investors in stocks will receive a return greater than the underlying corporate earnings yield. If the market’s valuation of those earnings declines, however, investors will receive a return less than the underlying corporate earnings yield. And, importantly, if the valuation of those earnings declines by a greater amount than the earnings yield, the overall return investors realize will be negative — regardless of how much earnings rise, or how much the economy grows.
Investors in bonds learned this lesson during the first three months of this year, as the price of long-term bonds declined far more than the coupon yield, and investors in stocks learned this lesson thoroughly during the 1970s. Corporate earnings tripled between 1970 and 1980, as gross domestic product more than doubled, but investors in stocks suffered a negative return due to falling valuations. The trend in the market’s valuation alone can determine whether stocks end up providing a positive or negative absolute return, and that is particularly the case when valuations are at extremes, as they are today.
Over the past forty years, the rate of inflation and interest rates have gone from one extreme (high) to the other (low), and the decline in both of those rates fueled the dramatic rise in the stock market’s valuation over that time frame. But investors today should be asking themselves whether or not there is room for those trends to continue, in light of the extreme lows in long-term yields reached last year and the Federal Reserve’s new commitment to higher inflation. If the lowest levels in interest rates and inflation rates have been seen, then the two strongest tailwinds powering the forty-year-long expansion in risk asset valuations have just turned into headwinds.
In some of his commentary since he released this new indicator last fall, Shiller has emphasized the dual nature of the market’s valuation at the moment — it is both expensive and reasonably priced. In his view, it is expensive based on its valuation relative to earnings, but it is reasonably priced given that cash and bonds offer negative real returns. Yet when the analysis stops there, it leaves out what is arguably the most important factor for equity investors: whether valuations will rise, fall or stay the same in the years ahead.
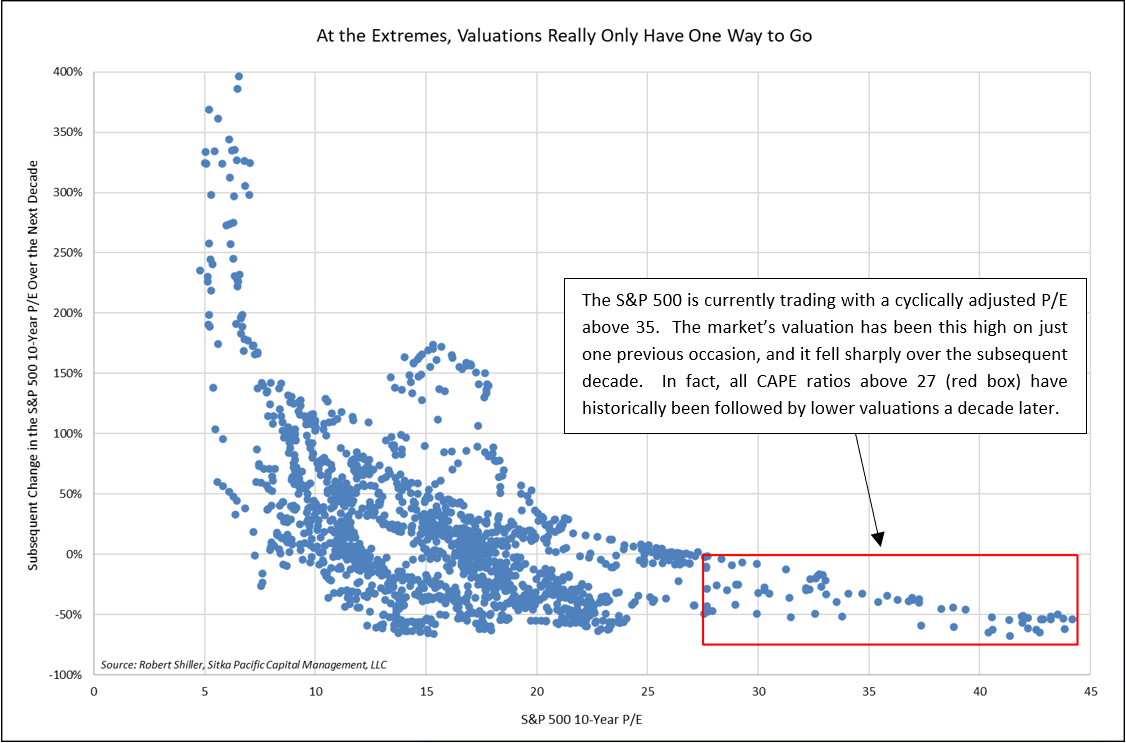
If valuations stay at these record levels, or rise, investors can expect to earn the current 2.8% earnings yield underlying stocks today, plus any rise in valuation. However, if valuations do not stay the same or rise further, it will only take a modest 2.8% average annual decline in valuation for stocks to join bonds and cash in having a negative return from today’s prices. The chart on the previous page suggests this outcome is quite likely, and the chart below highlights annualized returns realized when valuations have declined. While the Excess CAPE Yield may succinctly illustrate the rationale behind the surge in stocks over the past year, it offers investors no assurance of a positive absolute return.

* * *
This is an excerpt from our March 2021 Client Letter. This and other letters are available in their entirety at Recent Articles and Client Letters.
Follow Sitka Pacific at LinkedIn
Sitka Pacific Capital Management, LLC is an absolute return asset manager helping investors and advisors gain stability and independence from the markets. The content of this article is provided as general information only and is not intended to provide investment or other advice. This material is not to be construed as a recommendation or solicitation to buy or sell any security, financial product, instrument or to participate in any particular trading strategy. Sitka Pacific Capital Management, LLC provides investment advice solely through the management of its client accounts. This article may not be copied, reproduced, republished, or posted, in whole or in part, without prior written consent from Sitka Pacific Capital Management, LLC.
© Sitka Pacific Capital Management, LLC
Shiller’s ECY Makes Relative Sense, but the Market’s Absolute Return May Be Another Story
By Brian McAuley
April 22, 2021
We cannot know how the COVID-19 pandemic will end, and it may well end soon with the advent of effective vaccines. But a key takeaway of the ECY indicator is that it confirms the relative attractiveness of equities, particularly given a potentially protracted period of low interest rates. It may justify the FOMO narrative and go some way toward explaining the strong investor preference for equities since March.
Eventually, down the line, bond yields may just rise, and equity valuations may also have to reset alongside yields. But, at this point, despite the risks and the high CAPE ratios, stock-market valuations may not be as absurd as some people think.
– Robert Shiller, Making Sense of Sky-High Stock Prices, November 2020
It often happens that associations which end up leaving an indelible mark on our collective memory of certain market events are the result of sheer happenstance. One instance of this is our association of the phrase irrational exuberance with the peak of the tech bubble twenty-one years ago. The phrase is most widely associated with Yale professor Robert Shiller, whose book titled Irrational Exuberance happened to be published in March 2000 — the very month that marked the peak of the tech bubble. If there was a single moment in the last few decades which defined irrational exuberance in the stock market more than any other, it was the frenzied buying in those last weeks leading up to the March 2000 peak. From that moment, irrational exuberance entered our cultural lexicon as the definition of the bubble experience, and it has been there ever since.
If the book Irrational Exuberance had been published a year earlier, or a year later, the phrase probably would not have the same legacy, as Shiller was not the first person to publicly cite irrational exuberance during that period. Fed Chairman Alan Greenspan used it in congressional testimony to describe the conundrum facing policy makers in judging the value of the stock market in 1996. In hindsight, 1996 happened to be the year which marked the beginning of the tech bubble’s speculative frenzy, and if not for Shiller’s book, irrational exuberance may have had a different legacy; perhaps a phrase marking the beginning of a bubble, not the end. As it happens, Greenspan’s use of irrational exuberance marked the moment of liftoff of the tech bubble, while Shiller’s book marked the moment it came to a crashing end. Those two uses of the same phrase neatly bookended the most speculative period in stock market history.
While the precise timing of the publication of Irrational Exuberance in March of 2000 may have been random chance, Shiller proved in subsequent years that his analysis was not the result of happenstance. The appearance of the first edition of Irrational Exuberance marked the peak of the tech bubble within a month, and the second edition of the book was published in 2005 — and it included a detailed discussion of the housing bubble. Within a year of the publication of the second edition, home prices in the U.S. reached their peak, and in the years that followed, investors endured the bursting of the second major market bubble within a decade.
It is not an extremely complicated task to look at a market’s valuation and assess whether it is likely overvalued, but it is nearly impossible to know just when an overvalued market will stop becoming even more overvalued, and begin to deflate. Yet with the first two editions of Irrational Exuberance, Robert Shiller managed to do the nearly impossible — twice. As a point of fact, however, Chairman Greenspan’s assessment of the market’s overvaluation in 1996 proved not entirely off the mark. While Shiller’s book marked the precise moment the bubble popped, Greenspan’s assessment happened to be made early in what turned out to be the largest market bubble since 1929. In the end, all the of gains made subsequent to his testimony proved to be temporary, which showed that his basic assessment was correct; the S&P 500 traded at the same level in 2003, and again 2009, as it did when he testified before Congress in December 1996. The ephemeral nature of gains is a hallmark of an overvalued market, as is the difficulty in precisely timing the deflation of those short-lived gains.
The third edition of Irrational Exuberance, however, showed that even Robert Shiller was not immune from the inherent difficulty of timing an overvalued market. Published in 2015, in the third edition Shiller turned his attention to bonds, commenting that holding bonds at the low rates which existed at the time was not likely to end well for investors. Although he did not call it a speculative bubble, and thought bond yields could well remain low for a while longer, he also thought having long-term bond yields near the long-term rate of inflation — or below — was clearly unsustainable.
Six years later, we now know that not only can long-term bond yields remain low, they can sink to levels which were nearly unimaginable just a few years ago. At the time of the publication of the third edition of Irrational Exuberance, the 10-Year Treasury yield was fluctuating between 2% and 2.5%. Since then, the 10-Year Treasury yield has sunk to as low as 0.4%, and major benchmark yields outside the U.S., such as in Japan and Germany, have fallen below zero.
It is difficult to understate the impact the continued trend lower in long-term interest rates since 2015 has had on risk asset valuations, especially over the past year. When long-term “risk-free” rates fall to near zero, as in the case of the U.S. in 2020, or below zero, as continues to be the case in Japan and Germany, the higher yield received from other assets becomes all the more sought after. And when those long-term rates are below the expected rate of inflation, yields which remain above the rate of inflation are highly valued.
To better visualize this dynamic between low risk-free yields and the valuation of the stock market, Shiller released a new indicator last fall: the ECY, or the Excess CAPE Yield. The value of the ECY for the S&P 500 is calculated by taking the cyclically adjusted earnings yield (using the average earnings over the last ten years) and subtracting the real, inflation-adjusted 10-Year Treasury yield. The result is the excess real yield investors receive by owning the S&P 500 instead of 10-Year Treasury notes.
Yet choosing the “least bad” investment option does not guarantee it will lead to a positive absolute return. The overall return investors receive from publicly traded stocks is not simply the earnings of the underlying corporations — it is also a function of the value at which those earnings trade.Within the realm of institutional asset management, which is largely confined to assessing the relative attractiveness of stocks, bonds and cash equivalents, the blue line in the chart above showing the Excess CAPE Yield represents the best option among the three. With interest rates at zero, cash equivalents represent a near-certain inflation-adjusted loss in the years ahead. Long-term Treasury yields are also below the expected rate of inflation, and the rise in long-term rates this year highlights the added risk of these supposedly risk-free securities in the face of rising inflation expectations. Investment grade corporate bonds have also had a negative return this year. Amidst these poor cash and bond options, the positive excess earnings yield received by owning stocks seems to be the only real alternative when investment options are restricted to U.S. stocks, bonds, and cash.
The earnings yield of the S&P 500 is a combined measure of the earnings of the underlying companies and the valuation at which investors are currently willing to trade partial claims to those earnings. The absolute return that investors realize from owning stocks depends significantly on how the valuation of underlying corporate earnings changes, especially over the time horizons relevant to most investors — i.e., holding periods less than 15–20 years. If the market’s valuation of earnings rises, investors in stocks will receive a return greater than the underlying corporate earnings yield. If the market’s valuation of those earnings declines, however, investors will receive a return less than the underlying corporate earnings yield. And, importantly, if the valuation of those earnings declines by a greater amount than the earnings yield, the overall return investors realize will be negative — regardless of how much earnings rise, or how much the economy grows.
Investors in bonds learned this lesson during the first three months of this year, as the price of long-term bonds declined far more than the coupon yield, and investors in stocks learned this lesson thoroughly during the 1970s. Corporate earnings tripled between 1970 and 1980, as gross domestic product more than doubled, but investors in stocks suffered a negative return due to falling valuations. The trend in the market’s valuation alone can determine whether stocks end up providing a positive or negative absolute return, and that is particularly the case when valuations are at extremes, as they are today.
Over the past forty years, the rate of inflation and interest rates have gone from one extreme (high) to the other (low), and the decline in both of those rates fueled the dramatic rise in the stock market’s valuation over that time frame. But investors today should be asking themselves whether or not there is room for those trends to continue, in light of the extreme lows in long-term yields reached last year and the Federal Reserve’s new commitment to higher inflation. If the lowest levels in interest rates and inflation rates have been seen, then the two strongest tailwinds powering the forty-year-long expansion in risk asset valuations have just turned into headwinds.
In some of his commentary since he released this new indicator last fall, Shiller has emphasized the dual nature of the market’s valuation at the moment — it is both expensive and reasonably priced. In his view, it is expensive based on its valuation relative to earnings, but it is reasonably priced given that cash and bonds offer negative real returns. Yet when the analysis stops there, it leaves out what is arguably the most important factor for equity investors: whether valuations will rise, fall or stay the same in the years ahead.
If valuations stay at these record levels, or rise, investors can expect to earn the current 2.8% earnings yield underlying stocks today, plus any rise in valuation. However, if valuations do not stay the same or rise further, it will only take a modest 2.8% average annual decline in valuation for stocks to join bonds and cash in having a negative return from today’s prices. The chart on the previous page suggests this outcome is quite likely, and the chart below highlights annualized returns realized when valuations have declined. While the Excess CAPE Yield may succinctly illustrate the rationale behind the surge in stocks over the past year, it offers investors no assurance of a positive absolute return.
* * *
This is an excerpt from our March 2021 Client Letter. This and other letters are available in their entirety at Recent Articles and Client Letters.
Follow Sitka Pacific at LinkedIn
Sitka Pacific Capital Management, LLC is an absolute return asset manager helping investors and advisors gain stability and independence from the markets. The content of this article is provided as general information only and is not intended to provide investment or other advice. This material is not to be construed as a recommendation or solicitation to buy or sell any security, financial product, instrument or to participate in any particular trading strategy. Sitka Pacific Capital Management, LLC provides investment advice solely through the management of its client accounts. This article may not be copied, reproduced, republished, or posted, in whole or in part, without prior written consent from Sitka Pacific Capital Management, LLC.
© Sitka Pacific Capital Management, LLC
Investment Management
Before investing, we will discuss your goals and risk tolerances with you to see if a separately managed account at Sitka Pacific would be a good fit. To contact us for a free consultation, visit Getting Started.
Macro Value Monitor
To read a selection of recent client letters and be alerted when new letters are posted to our public site, visit Recent Client Letters.