
Investment Management
Macro Value Monitor

Reflections on Abrupt Pivots and the Creeping Consequences of Great Mistakes
November 9, 2022
U.S. consumer inflation excluding energy and food accelerated to a new four-decade high in September, a sign that strong and broad price pressures are persisting. The Labor Department on Thursday said that its so-called core consumer-price index—which excludes volatile energy and food prices—rose 6.6% in September from a year earlier, the biggest increase since August 1982. The measure increased 6.3% in August.
The inflation report likely keeps the Federal Reserve on track to increase interest rates by 0.75 percentage point at its meeting next month. It also raises the risk officials will delay an anticipated slowdown in the pace of rate rises after that or signal that they are likely to raise rates to even higher levels early next year than previously anticipated by policy makers and investors…
~ The Wall Street Journal, October 13, 2022
Federal Reserve Chair Jerome Powell opened a new phase in his campaign to regain control of inflation, saying US interest rates will go higher than earlier projected, but the path may soon involve smaller hikes.
Addressing reporters Wednesday after the Fed raised rates by 75 basis points for the fourth time in a row, Powell said “incoming data since our last meeting suggests that ultimate level of interest rates will be higher than previously expected.”
Powell said is it would be appropriate to slow the pace of increases “as soon as the next meeting or the one after that. No decision has been made,” he said, while stressing that “we still have some ways” before rates were tight enough. “It is very premature to be thinking about pausing,” he said.…
~ Bloomberg, November 2, 2022

When something truly extraordinary happens in the financial markets, as it has this year, it is worthwhile to pause for a few moments, and reflect.
Over the last forty years, a period which encompasses all of the time most investors today have been navigating the financial markets, the underlying current propelling returns from stocks and bonds has been flowing in one direction. Incredibly, throughout these four decades, this one-directional flow allowed investors to earn a higher return than the underlying coupon yield from bonds and the underlying earnings yield from stocks.
For bond investors who maintained a targeted duration, their total return was higher than the yield on their bonds because the decline in yields in the markets allowed bonds to be repeatedly rolled over above par. For investors in stocks, their total return was higher than the underlying earnings yield on the companies they invested in, because rising valuations compounded market prices above and beyond the rate due solely to earnings.
As we discussed this past summer, the higher returns of the last forty years represented a bountiful triple dip, a seemingly unending virtuous cycle in which valuations spiraled ever higher. In 1981, the cyclically-adjusted price-to-earnings (CAPE) ratio of the S&P Composite ended the year at 7.83. Forty years later, the CAPE ended 2021 at 38.83. The bountiful triple dip of expanding valuations accounted for 38% of the total return earned from stocks between 1981 and 2021, and allowed investors to earn a compounded return that was 62% higher than the underlying return from earnings.
In 2021, however, the underlying current which enabled those higher returns turned around and began flowing…in the opposite direction. A 40-year flood tide began to ebb, and the bountiful triple dip turned into a rip tide of devaluation. The implications of this shift can hardly be understated, and, in fact, for many it seems the implications cannot yet be acknowledged, let alone accepted. As is often the case with major (trend) changes, the reality of it will take time to fully sink in.
Back in January, we reviewed the history of John Law, the Banque Royale, and the Mississippi Bubble in 1719 and 1720. If you recall, the early motivation behind establishing Law’s bank was that the Regent had found the royal government near bankruptcy when Louis XIV passed away in 1715. Facing a politically unpalatable range of options to address the dire fiscal situation, the establishment of the bank – and it’s printing presses – enabled an easy way out. As the bank facilitated a supply of money unfastened from the gold and silver coin in circulation, it became easier to meet the government’s obligations without directly defaulting on constituencies powerful enough to challenge the moral authority of the monarchy.
With that, the immediate threat of a financial crisis passed without incident.
Several years later, however, the money supply had grown exponentially. The ease at which problems could be papered over with new banknotes quickly became the norm by which government functioned, and as Law’s various development plans and expansionary schemes took root, the siren song produced by the busy printing presses proved irresistible. Wealth seemingly soared beyond all imagination, and there appeared to be no limit to the growth that could be achieved by expanding the money supply ever further.
At first, the expanding supply of banknotes mainly impacted the price of investments. Shares of the Company of the West, collectables such as fine art, and as well as the vast estates in the French countryside where such art was displayed all soared in price. These were the spending provinces of those fortunate few already-wealthy individuals with early access to the new banknotes flooding out of the Banque Royale.
The pivotal moment came when the prices of everyday goods began to rise alongside investments. In time, as a greater share of the new money filtered out into the broader French economy, the price of fuel, cloth, food and other basic necessities were bid higher and higher by the escalating number of banknotes circulating throughout France. And when the prices of goods began rising, it marked a pivot away from a virtuous cycle of expanding asset wealth to the vicious cycle of contracting asset wealth with broad-based, economy-wide inflation.
Three hundred years later, over the past two years, our economy and markets passed through a similar pivot. After a decade in which the major central banks expanded the base money supply upon which all money and credit stands by an order of magnitude, prices throughout the global economy began to rise at rates that were last seen during the Great Inflation of the 1970s. And just as in France in 1720, and in the early stages of the Great Inflation, financial assets began to devalue the moment prices throughout the broader economy pivoted higher.
In the most recent headline inflation report, it was reported that consumer prices in the U.S. had risen 8.2% from September 2021 to September 2022. The headline rate has been declining modestly since peaking at 9.0% in June, the highest rate in two generations, due to a decline in energy prices.
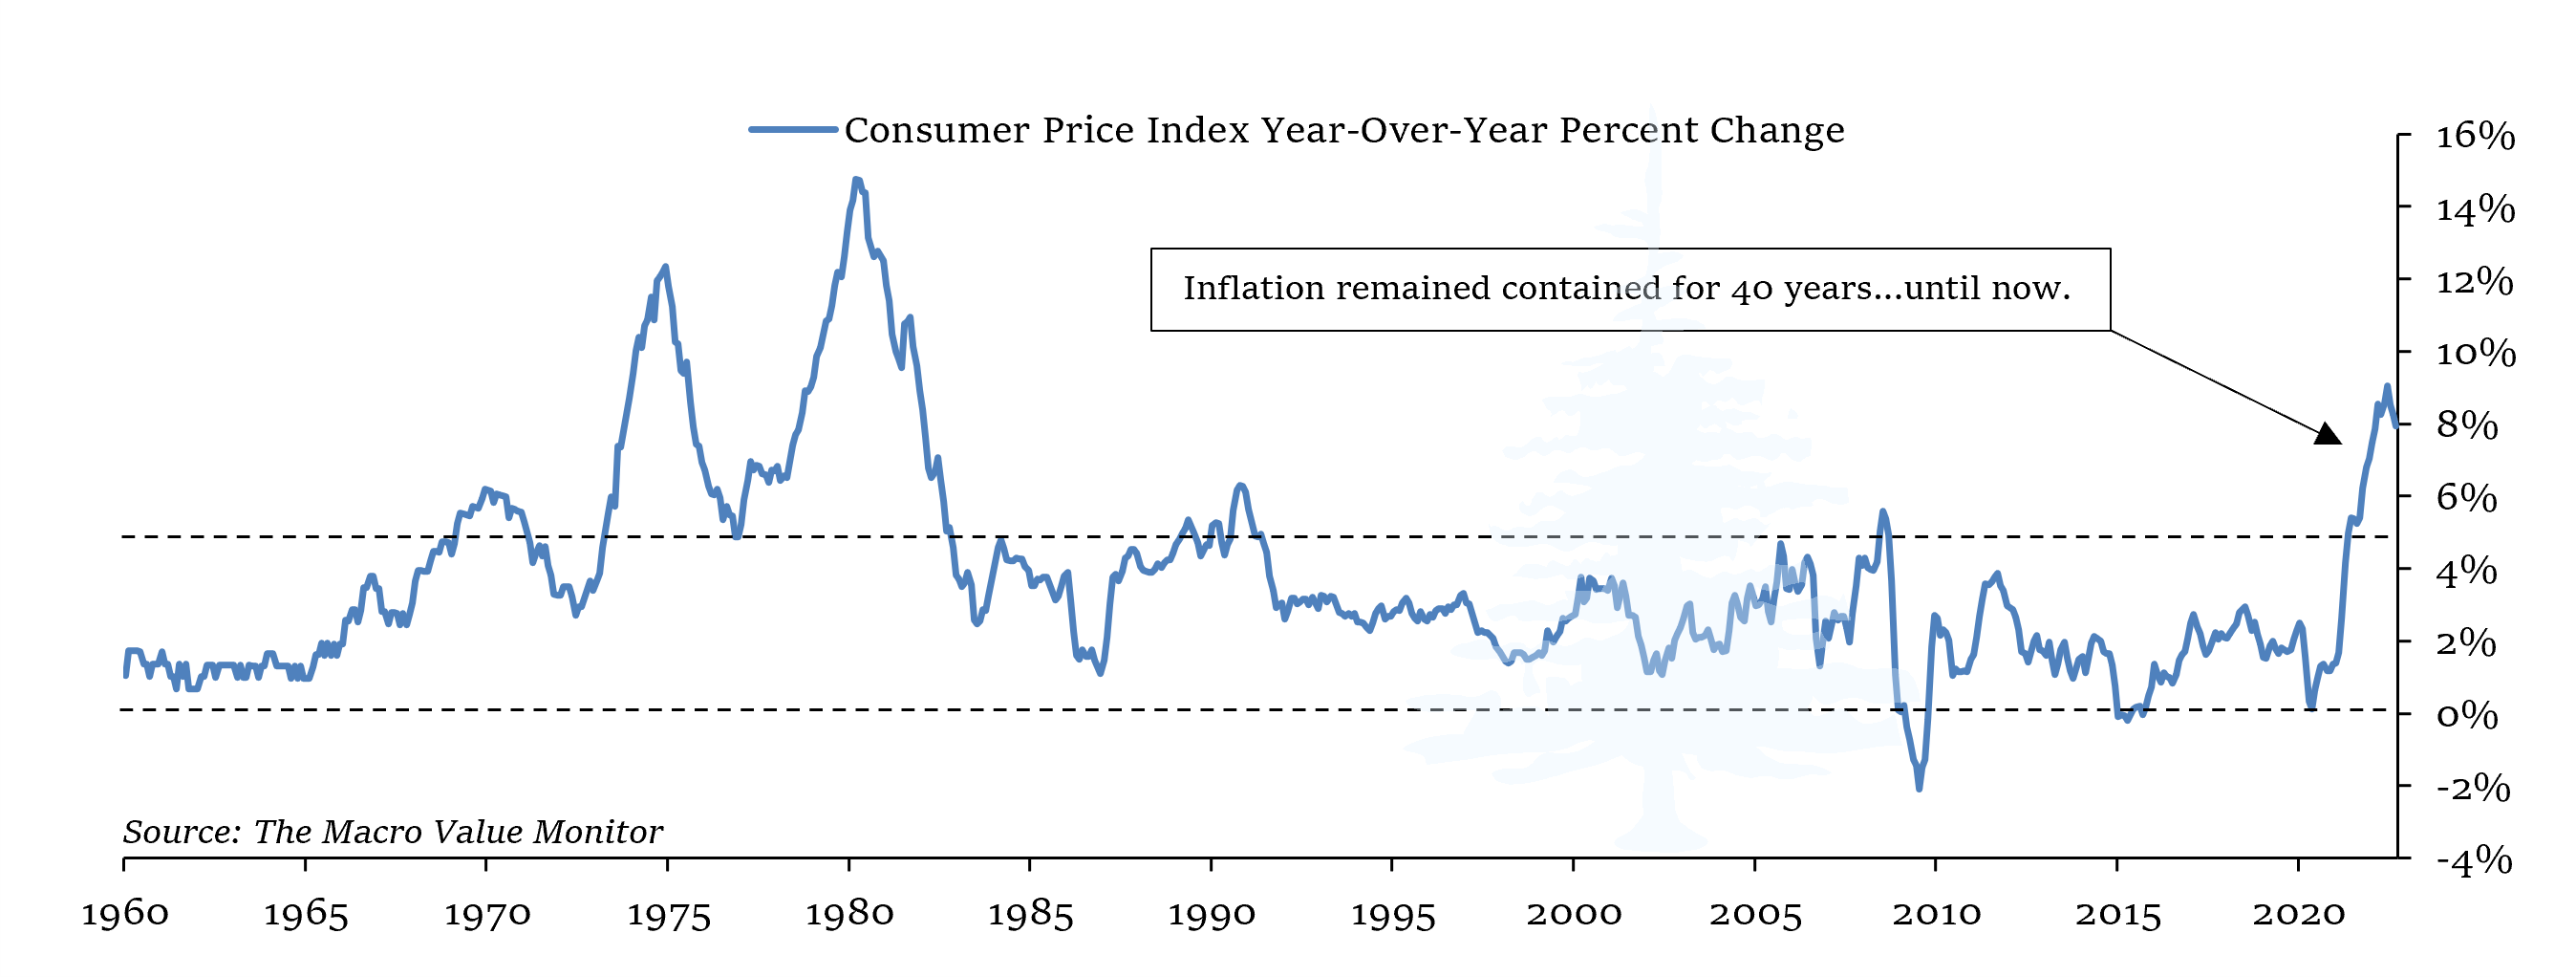
The modest decline in the headline rate, however, masked a continued build of inflationary pressure over the summer. The index of consumer prices excluding food and energy prices reached a 6.7% year-over-year rate of increase in September, the highest rate recorded over the past year. Other inflation measures, such as the “Sticky Price” consumer price index, which measures a subset of prices in the economy that do not typically change more frequently than once every 4.3 months, also reached a new high rate of change in September.
For those categories included in the “core” and the “sticky” consumer price indexes, the latest report showed that not only are prices rising at the fastest rates since 1982 – the pace is still accelerating.
Inflation rates in the U.S. and the rest of the developed world remained contained for forty years, but the rise in prices over the past year clearly marks the end of the disinflationary post-Volker era. This can be seen in the inflation rate shown above, but most importantly, the bond market sees it this way as well. Just as inflation rates have been contained for forty years until now, long-term Treasury bond yields trended lower for forty years…until now.
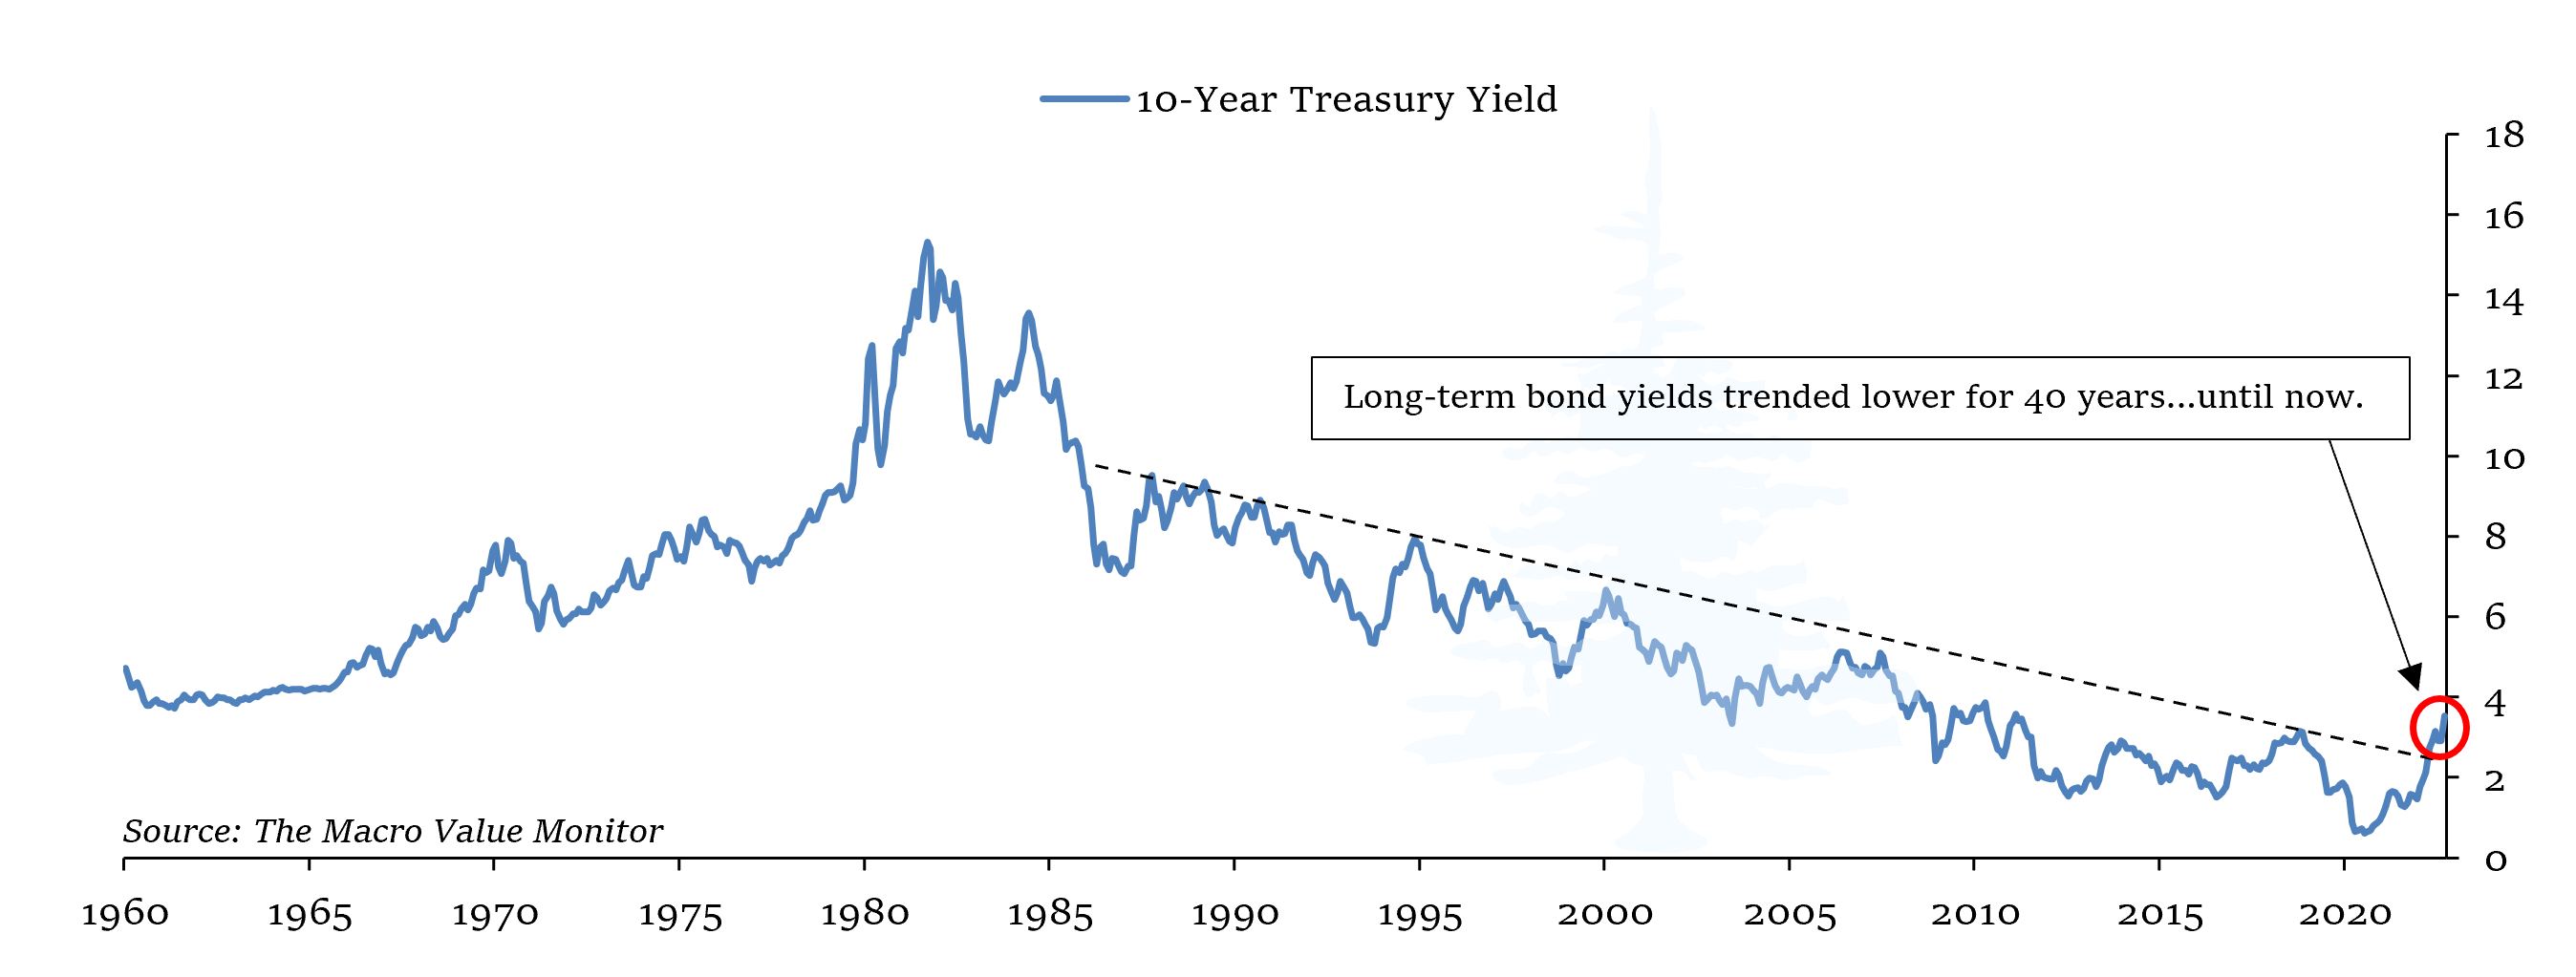
For those investors who began actively navigating the markets after July of 1980, the rise in bond yields over the past two years has been unlike any other. It has quickly shattered the downtrend in place since the early 1980s, with the 10, 20 and 30-year Treasury yields rapidly rising above the last cyclical high that was made in late 2018. Critically, nominal and real yields have diverged in a manner not seen since the 1970s: although nominal yields have rapidly increased this year, real, inflation-adjusted yields have rapidly decreased. While the yield on the 10-year Treasury note recently traded above 4%, the rapid rise of inflation reduced that nominal yield to a negative 4.2% inflation-adjusted yield. This has been the first sustained period of negative real Treasury bond yields since 1979-1980.
Amidst this nominal and inflation-adjusted diversion, the speed and scale of the losses in bonds has been staggering.
The price of the 30-year Treasury bond has fallen 36% from its highest price in 2020, and today it trades at the lowest level since 2011. Any investor who bought 30-year Treasury bonds in the last decade has lost all of their accumulated return, as the paltry yields since 2011 were not enough to offset the loss of value over the past two years. That has also been the case for mid-duration Treasuries, and with high quality corporate bonds. With an average yield of 2.1% between 2011 and 2020, investors in 10-year Treasury notes now have a -1% total return over the past decade. And as AAA-rated corporate bond yields have doubled from 2.6% to 5.2%, a typical basket of corporate bonds has lost 35% of its value – a return which effectively claws back the average 3.6% yield over the past decade.
The sudden evaporation of a decade’s worth of returns is one consequence of the abrupt inflationary pivot, and it is part of the reversal of the current which has propelled market returns over the past four decades. When interest rates and yields rise, valuations decline – and the bountiful triple dip comes to an end.
However, despite the historic losses over the past year, it is important to understand that the markets may have only just begun adjusting to this new inflationary environment. The decline of stocks and bonds this year has resulted in a large loss for the standard 60/40 portfolio, yet the underlying yield of such a portfolio has only risen from the record low in 2021 to the lowest yields seen in prior cycles.
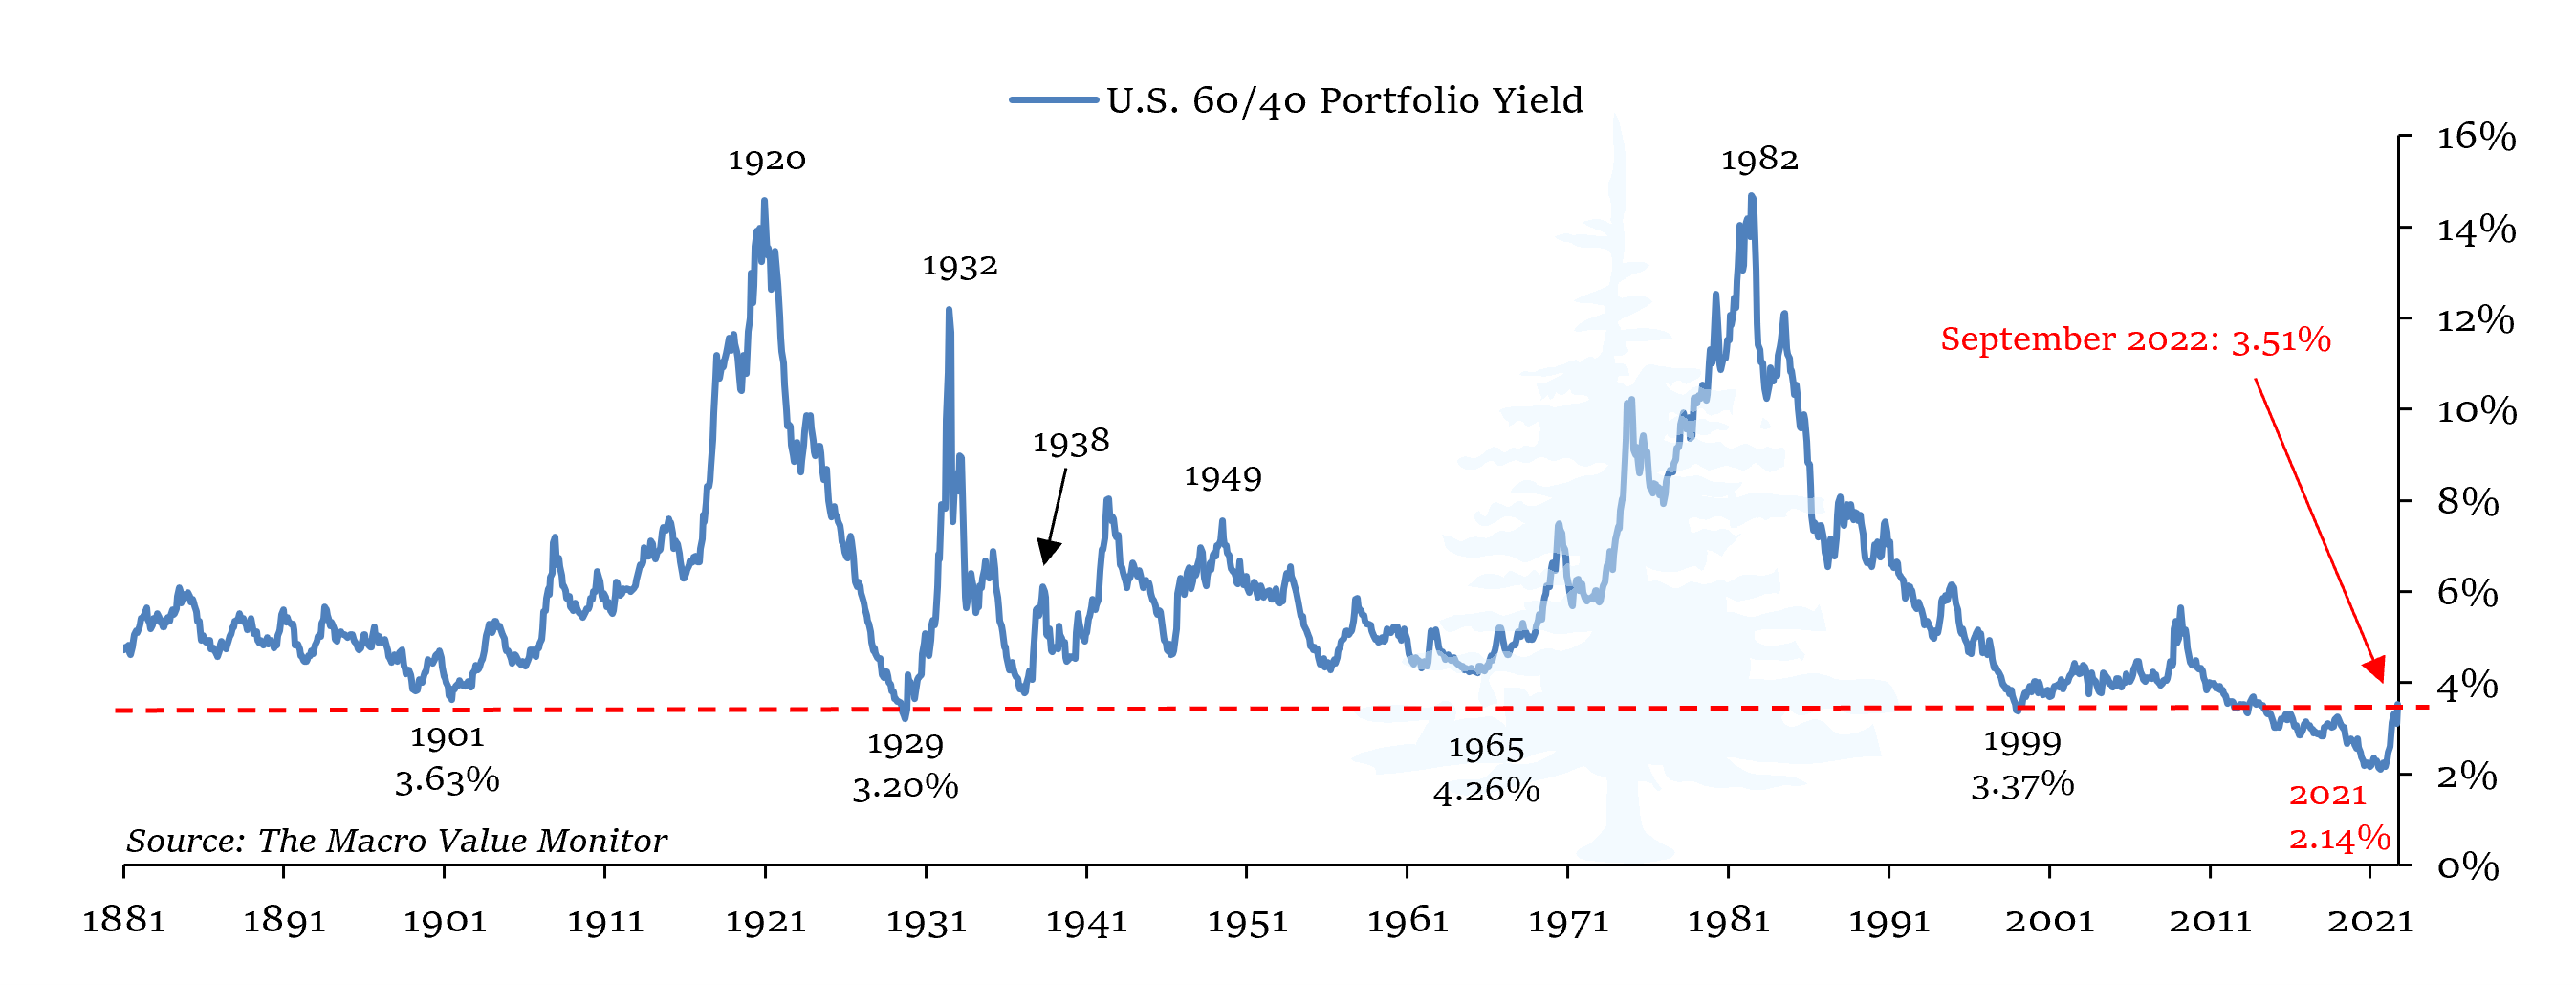
At the end of the third quarter, the cyclically-adjusted earnings yield of the S&P Composite and an index of Treasury bonds (shown above) had risen 64% this year, a sharp rise that mirrors the sharp losses in stocks and bonds. However, at 3.51% in September, yields on stocks and bonds remained near the lowest levels in history outside the past decade.
At the peak of the market in 1929, the lowest 60/40 portfolio yield recorded was 3.2%, but in the tumultuous years that followed it rose as high as 12%, before settling at 5.1% in 1939. At the peak of the tech bubble in 2000, the lowest portfolio yield recorded was 3.8%, and it rose to 5.6% in 2009. This modest rise in the yield of a portfolio of stocks and bonds was enough to create a lost decade of returns, as we’ll discuss in more detail later.
In January of 1966, a 60/40 portfolio of stocks and bonds offered a cyclically-adjusted yield of 4.3%, which is 23% above the level reached in September of this year. As inflation took root in the years that followed, the yield from stocks and bonds climbed to 6.63% in January 1970, then continued to climb higher from there – reaching 10% in 1974, and 12% in 1980. Stocks and bonds reached a peak yield of 14.7% in June 1982, more than sixteen years after inflation first took root.
The year-over-year inflation rate in June 1982 was 7.1%, which is lower than it has been recently. This puts the rise in the cyclically-adjusted yield of stocks and bonds this year from 2.1% to 3.5% into perspective: as steep as the rise has been, the market has always eventually adjusted the price of stocks and bonds to offer a yield that is higher than inflation.
The markets maintained a positive inflation-adjusted yield throughout the last forty years…until the past year, when the real 60/40 portfolio dropped below zero as the inflation rate rose. Although the rise in the yield of stocks and bonds this year has been steep, it has not been enough to prevent the deepest negative yields since 1947. Historically, high inflation and negative real portfolio yields have created the most hostile environment for stocks and bonds – and that has been reflected in the low valuation stocks have historically traded at when inflation-adjusted yields are negative.
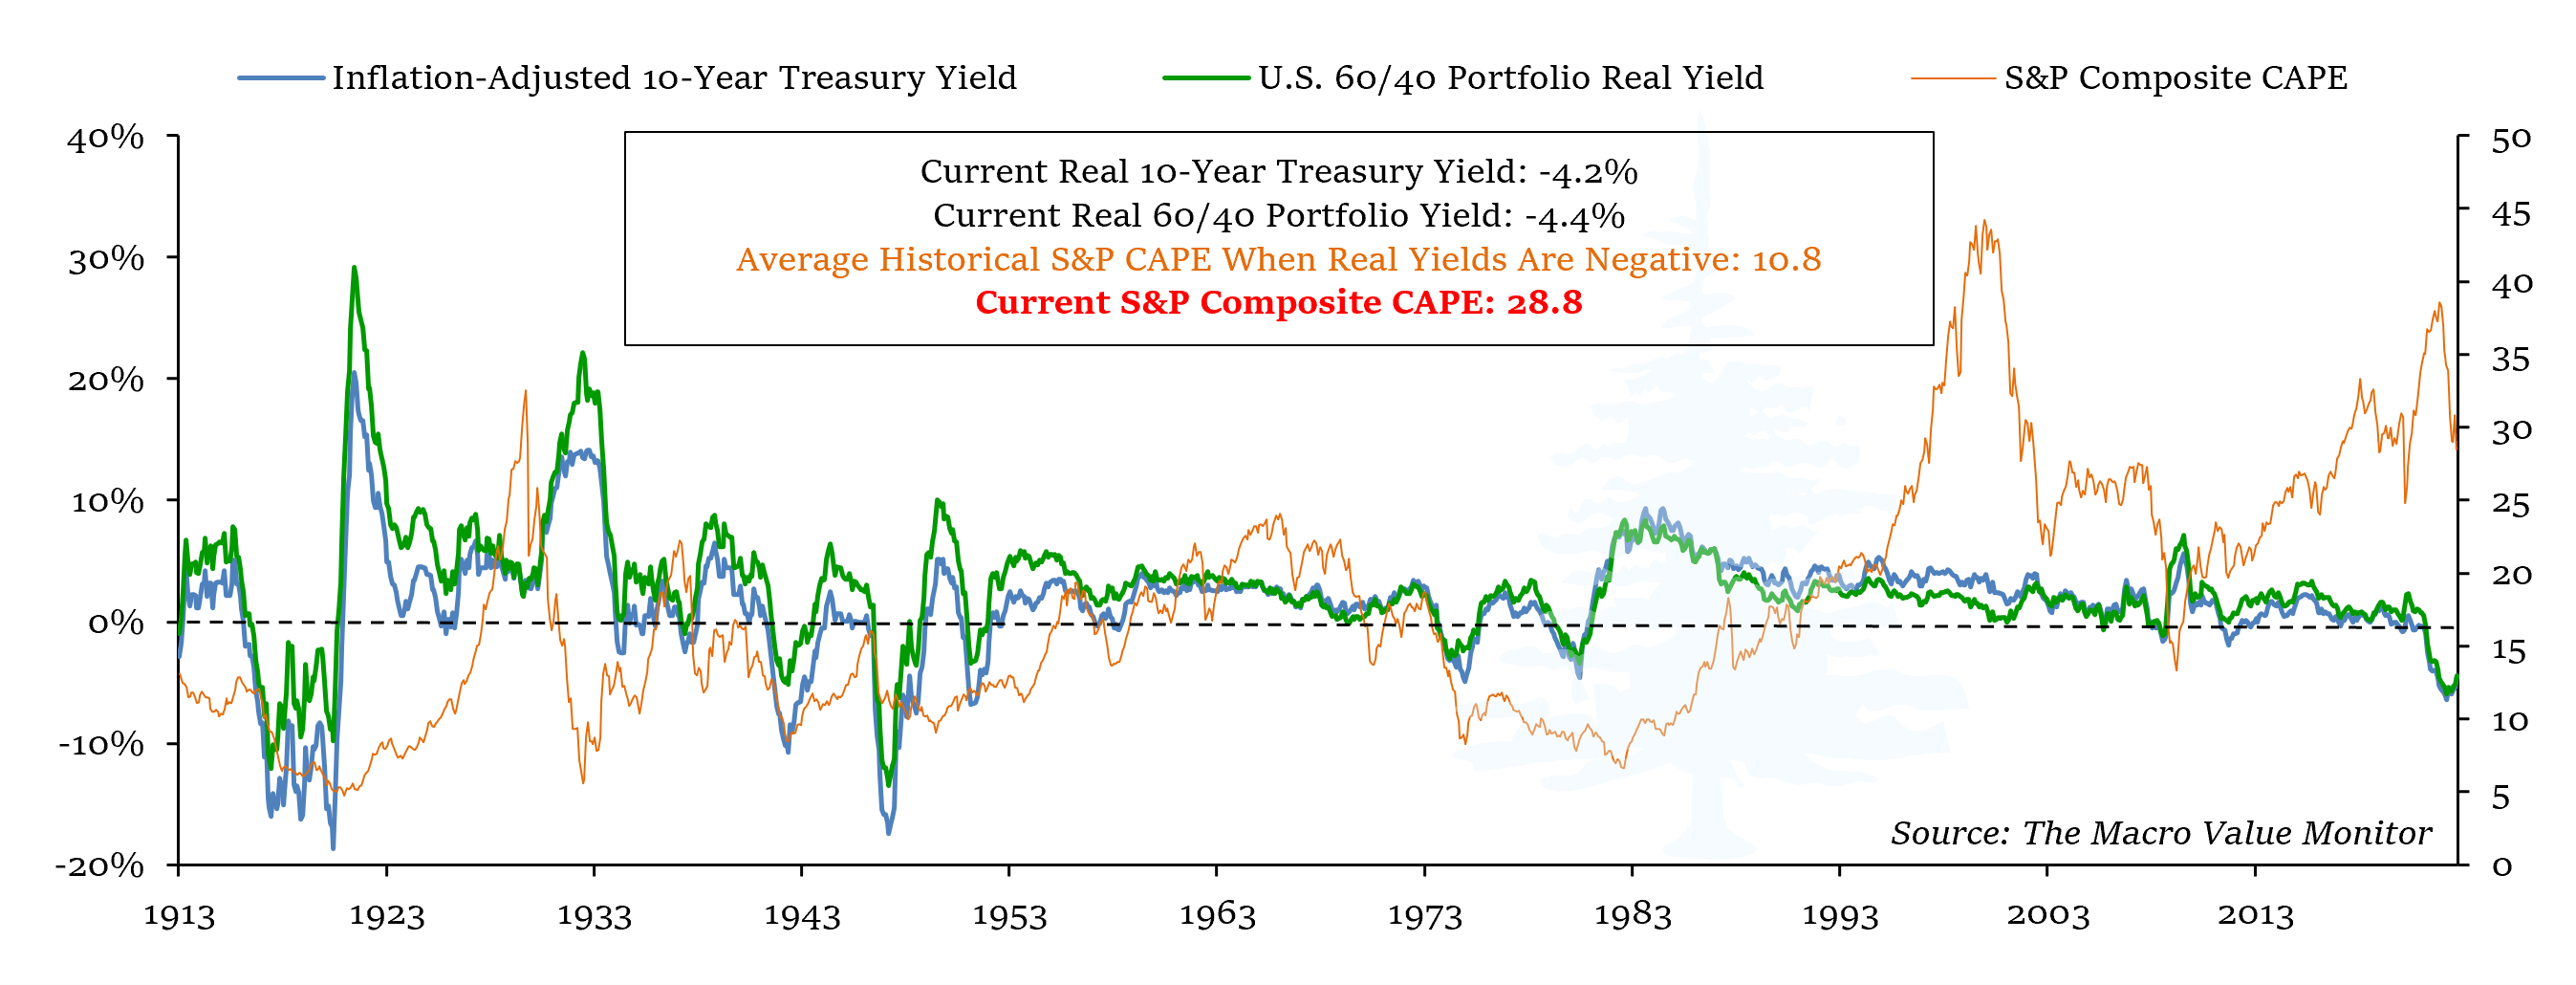
As we have discussed, one of the main consequences of the Third Great Mistake is the inability of the Federal Reserve to adequately address higher inflation, due to the high level of debt throughout the economy. From the financial market’s perspective, monetary policy remaining stuck between high inflation and high indebtedness means there is no pain-free way to address inflation: it means inflation remains higher than desired, or inflation-adjusted corporate profitability declines more than expected, or some combination of both. None of these options are supportive of high risk-asset valuations. In fact, as you can see in the chart below, the cyclically-adjusted valuation of the S&P Composite has historically averaged one-third of its September level when real yields are negative due to high inflation, as they are today.
The creeping inflationary consequences of the Federal Reserve’s Third Great Mistake have already had a significant impact on valuations of stocks and bonds, but with inflation running at an 8% year-over-year rate and a standard portfolio of stocks and bonds offering a 3.5% yield, valuations could fall much further than they have so far this year. As investors slowly come to terms with the new inflationary regime, a vicious cycle of rising yields and declining valuations could unwind the bountiful triple dip of the past forty years, just as it did during the Federal Reserve’s Second Great Mistake half a century ago.
* * *
The above is part 1 of Volume I Issue IX of The Macro Value Monitor, a publication focusing on Monetary History, Market Myths, Investing Legends, and Real Global Value.
Part II, An Inflationary Era Requires Taking a Road Less Traveled (If You Are Seeking a Positive Return), is available on Substack.
The content of this document is provided as general information and is for educational purposes only. It is not intended to provide investment or other advice. This material is not to be construed as a recommendation or solicitation to buy or sell any security, financial product, instrument or to participate in any particular trading strategy. Not all securities, products or services described are available in all countries, and nothing herein constitutes an offer or solicitation of any securities, products or services in any jurisdiction where their offer or sale is not qualified or exempt from registration or otherwise legally permissible.
Although the material herein is based upon information considered reliable and up-to-date, Sitka Pacific Publishing, LLC does not assure that this material is accurate, current, or complete, and it should not be relied upon as such. Content in this document may not be copied, reproduced, republished, or posted, in whole or in part, without prior written consent from Sitka Pacific Publishing, LLC — which is usually gladly given, as long as its use includes clear and proper attribution. Contact us for more information.
© Sitka Pacific Publishing, LLC
Reflections on Abrupt Pivots and the Creeping Consequences of Great Mistakes
November 9, 2022
U.S. consumer inflation excluding energy and food accelerated to a new four-decade high in September, a sign that strong and broad price pressures are persisting. The Labor Department on Thursday said that its so-called core consumer-price index—which excludes volatile energy and food prices—rose 6.6% in September from a year earlier, the biggest increase since August 1982. The measure increased 6.3% in August.
The inflation report likely keeps the Federal Reserve on track to increase interest rates by 0.75 percentage point at its meeting next month. It also raises the risk officials will delay an anticipated slowdown in the pace of rate rises after that or signal that they are likely to raise rates to even higher levels early next year than previously anticipated by policy makers and investors…
~ The Wall Street Journal, October 13, 2022
Federal Reserve Chair Jerome Powell opened a new phase in his campaign to regain control of inflation, saying US interest rates will go higher than earlier projected, but the path may soon involve smaller hikes.
Addressing reporters Wednesday after the Fed raised rates by 75 basis points for the fourth time in a row, Powell said “incoming data since our last meeting suggests that ultimate level of interest rates will be higher than previously expected.”
Powell said is it would be appropriate to slow the pace of increases “as soon as the next meeting or the one after that. No decision has been made,” he said, while stressing that “we still have some ways” before rates were tight enough. “It is very premature to be thinking about pausing,” he said.…
~ Bloomberg, November 2, 2022
When something truly extraordinary happens in the financial markets, as it has this year, it is worthwhile to pause for a few moments, and reflect.
Over the last forty years, a period which encompasses all of the time most investors today have been navigating the financial markets, the underlying current propelling returns from stocks and bonds has been flowing in one direction. Incredibly, throughout these four decades, this one-directional flow allowed investors to earn a higher return than the underlying coupon yield from bonds and the underlying earnings yield from stocks.
For bond investors who maintained a targeted duration, their total return was higher than the yield on their bonds because the decline in yields in the markets allowed bonds to be repeatedly rolled over above par. For investors in stocks, their total return was higher than the underlying earnings yield on the companies they invested in, because rising valuations compounded market prices above and beyond the rate due solely to earnings.
As we discussed this past summer, the higher returns of the last forty years represented a bountiful triple dip, a seemingly unending virtuous cycle in which valuations spiraled ever higher. In 1981, the cyclically-adjusted price-to-earnings (CAPE) ratio of the S&P Composite ended the year at 7.83. Forty years later, the CAPE ended 2021 at 38.83. The bountiful triple dip of expanding valuations accounted for 38% of the total return earned from stocks between 1981 and 2021, and allowed investors to earn a compounded return that was 62% higher than the underlying return from earnings.
In 2021, however, the underlying current which enabled those higher returns turned around and began flowing…in the opposite direction. A 40-year flood tide began to ebb, and the bountiful triple dip turned into a rip tide of devaluation. The implications of this shift can hardly be understated, and, in fact, for many it seems the implications cannot yet be acknowledged, let alone accepted. As is often the case with major (trend) changes, the reality of it will take time to fully sink in.
Back in January, we reviewed the history of John Law, the Banque Royale, and the Mississippi Bubble in 1719 and 1720. If you recall, the early motivation behind establishing Law’s bank was that the Regent had found the royal government near bankruptcy when Louis XIV passed away in 1715. Facing a politically unpalatable range of options to address the dire fiscal situation, the establishment of the bank – and it’s printing presses – enabled an easy way out. As the bank facilitated a supply of money unfastened from the gold and silver coin in circulation, it became easier to meet the government’s obligations without directly defaulting on constituencies powerful enough to challenge the moral authority of the monarchy.
With that, the immediate threat of a financial crisis passed without incident.
Several years later, however, the money supply had grown exponentially. The ease at which problems could be papered over with new banknotes quickly became the norm by which government functioned, and as Law’s various development plans and expansionary schemes took root, the siren song produced by the busy printing presses proved irresistible. Wealth seemingly soared beyond all imagination, and there appeared to be no limit to the growth that could be achieved by expanding the money supply ever further.
At first, the expanding supply of banknotes mainly impacted the price of investments. Shares of the Company of the West, collectables such as fine art, and as well as the vast estates in the French countryside where such art was displayed all soared in price. These were the spending provinces of those fortunate few already-wealthy individuals with early access to the new banknotes flooding out of the Banque Royale.
The pivotal moment came when the prices of everyday goods began to rise alongside investments. In time, as a greater share of the new money filtered out into the broader French economy, the price of fuel, cloth, food and other basic necessities were bid higher and higher by the escalating number of banknotes circulating throughout France. And when the prices of goods began rising, it marked a pivot away from a virtuous cycle of expanding asset wealth to the vicious cycle of contracting asset wealth with broad-based, economy-wide inflation.
Three hundred years later, over the past two years, our economy and markets passed through a similar pivot. After a decade in which the major central banks expanded the base money supply upon which all money and credit stands by an order of magnitude, prices throughout the global economy began to rise at rates that were last seen during the Great Inflation of the 1970s. And just as in France in 1720, and in the early stages of the Great Inflation, financial assets began to devalue the moment prices throughout the broader economy pivoted higher.
In the most recent headline inflation report, it was reported that consumer prices in the U.S. had risen 8.2% from September 2021 to September 2022. The headline rate has been declining modestly since peaking at 9.0% in June, the highest rate in two generations, due to a decline in energy prices.
The modest decline in the headline rate, however, masked a continued build of inflationary pressure over the summer. The index of consumer prices excluding food and energy prices reached a 6.7% year-over-year rate of increase in September, the highest rate recorded over the past year. Other inflation measures, such as the “Sticky Price” consumer price index, which measures a subset of prices in the economy that do not typically change more frequently than once every 4.3 months, also reached a new high rate of change in September.
For those categories included in the “core” and the “sticky” consumer price indexes, the latest report showed that not only are prices rising at the fastest rates since 1982 – the pace is still accelerating.
Inflation rates in the U.S. and the rest of the developed world remained contained for forty years, but the rise in prices over the past year clearly marks the end of the disinflationary post-Volker era. This can be seen in the inflation rate shown above, but most importantly, the bond market sees it this way as well. Just as inflation rates have been contained for forty years until now, long-term Treasury bond yields trended lower for forty years…until now.
For those investors who began actively navigating the markets after July of 1980, the rise in bond yields over the past two years has been unlike any other. It has quickly shattered the downtrend in place since the early 1980s, with the 10, 20 and 30-year Treasury yields rapidly rising above the last cyclical high that was made in late 2018. Critically, nominal and real yields have diverged in a manner not seen since the 1970s: although nominal yields have rapidly increased this year, real, inflation-adjusted yields have rapidly decreased. While the yield on the 10-year Treasury note recently traded above 4%, the rapid rise of inflation reduced that nominal yield to a negative 4.2% inflation-adjusted yield. This has been the first sustained period of negative real Treasury bond yields since 1979-1980.
Amidst this nominal and inflation-adjusted diversion, the speed and scale of the losses in bonds has been staggering.
The price of the 30-year Treasury bond has fallen 36% from its highest price in 2020, and today it trades at the lowest level since 2011. Any investor who bought 30-year Treasury bonds in the last decade has lost all of their accumulated return, as the paltry yields since 2011 were not enough to offset the loss of value over the past two years. That has also been the case for mid-duration Treasuries, and with high quality corporate bonds. With an average yield of 2.1% between 2011 and 2020, investors in 10-year Treasury notes now have a -1% total return over the past decade. And as AAA-rated corporate bond yields have doubled from 2.6% to 5.2%, a typical basket of corporate bonds has lost 35% of its value – a return which effectively claws back the average 3.6% yield over the past decade.
The sudden evaporation of a decade’s worth of returns is one consequence of the abrupt inflationary pivot, and it is part of the reversal of the current which has propelled market returns over the past four decades. When interest rates and yields rise, valuations decline – and the bountiful triple dip comes to an end.
However, despite the historic losses over the past year, it is important to understand that the markets may have only just begun adjusting to this new inflationary environment. The decline of stocks and bonds this year has resulted in a large loss for the standard 60/40 portfolio, yet the underlying yield of such a portfolio has only risen from the record low in 2021 to the lowest yields seen in prior cycles.
At the end of the third quarter, the cyclically-adjusted earnings yield of the S&P Composite and an index of Treasury bonds (shown above) had risen 64% this year, a sharp rise that mirrors the sharp losses in stocks and bonds. However, at 3.51% in September, yields on stocks and bonds remained near the lowest levels in history outside the past decade.
At the peak of the market in 1929, the lowest 60/40 portfolio yield recorded was 3.2%, but in the tumultuous years that followed it rose as high as 12%, before settling at 5.1% in 1939. At the peak of the tech bubble in 2000, the lowest portfolio yield recorded was 3.8%, and it rose to 5.6% in 2009. This modest rise in the yield of a portfolio of stocks and bonds was enough to create a lost decade of returns, as we’ll discuss in more detail later.
In January of 1966, a 60/40 portfolio of stocks and bonds offered a cyclically-adjusted yield of 4.3%, which is 23% above the level reached in September of this year. As inflation took root in the years that followed, the yield from stocks and bonds climbed to 6.63% in January 1970, then continued to climb higher from there – reaching 10% in 1974, and 12% in 1980. Stocks and bonds reached a peak yield of 14.7% in June 1982, more than sixteen years after inflation first took root.
The year-over-year inflation rate in June 1982 was 7.1%, which is lower than it has been recently. This puts the rise in the cyclically-adjusted yield of stocks and bonds this year from 2.1% to 3.5% into perspective: as steep as the rise has been, the market has always eventually adjusted the price of stocks and bonds to offer a yield that is higher than inflation.
The markets maintained a positive inflation-adjusted yield throughout the last forty years…until the past year, when the real 60/40 portfolio dropped below zero as the inflation rate rose. Although the rise in the yield of stocks and bonds this year has been steep, it has not been enough to prevent the deepest negative yields since 1947. Historically, high inflation and negative real portfolio yields have created the most hostile environment for stocks and bonds – and that has been reflected in the low valuation stocks have historically traded at when inflation-adjusted yields are negative.
As we have discussed, one of the main consequences of the Third Great Mistake is the inability of the Federal Reserve to adequately address higher inflation, due to the high level of debt throughout the economy. From the financial market’s perspective, monetary policy remaining stuck between high inflation and high indebtedness means there is no pain-free way to address inflation: it means inflation remains higher than desired, or inflation-adjusted corporate profitability declines more than expected, or some combination of both. None of these options are supportive of high risk-asset valuations. In fact, as you can see in the chart below, the cyclically-adjusted valuation of the S&P Composite has historically averaged one-third of its September level when real yields are negative due to high inflation, as they are today.
The creeping inflationary consequences of the Federal Reserve’s Third Great Mistake have already had a significant impact on valuations of stocks and bonds, but with inflation running at an 8% year-over-year rate and a standard portfolio of stocks and bonds offering a 3.5% yield, valuations could fall much further than they have so far this year. As investors slowly come to terms with the new inflationary regime, a vicious cycle of rising yields and declining valuations could unwind the bountiful triple dip of the past forty years, just as it did during the Federal Reserve’s Second Great Mistake half a century ago.
* * *
The above is part 1 of Volume I Issue IX of The Macro Value Monitor, a publication focusing on Monetary History, Market Myths, Investing Legends, and Real Global Value.
Part II, An Inflationary Era Requires Taking a Road Less Traveled (If You Are Seeking a Positive Return), is available on Substack.
The content of this document is provided as general information and is for educational purposes only. It is not intended to provide investment or other advice. This material is not to be construed as a recommendation or solicitation to buy or sell any security, financial product, instrument or to participate in any particular trading strategy. Not all securities, products or services described are available in all countries, and nothing herein constitutes an offer or solicitation of any securities, products or services in any jurisdiction where their offer or sale is not qualified or exempt from registration or otherwise legally permissible.
Although the material herein is based upon information considered reliable and up-to-date, Sitka Pacific Publishing, LLC does not assure that this material is accurate, current, or complete, and it should not be relied upon as such. Content in this document may not be copied, reproduced, republished, or posted, in whole or in part, without prior written consent from Sitka Pacific Publishing, LLC — which is usually gladly given, as long as its use includes clear and proper attribution. Contact us for more information.
© Sitka Pacific Publishing, LLC
Investment Management
Before investing, we will discuss your goals and risk tolerances with you to see if a separately managed account at Sitka Pacific would be a good fit. To contact us for a free consultation, visit Getting Started.
Macro Value Monitor
To read a selection of recent client letters and be alerted when new letters are posted to our public site, visit Recent Client Letters.