
Investment Management
Macro Value Monitor

The Triumph and Erosion of Exceptionalism
3rd Quarter, 2025
A battered dollar is taking another beating as investors, unnerved by fresh signs of an erosion in U.S. central bank independence, waste no time in pushing the greenback back to its lowest levels in over three years.
Down 10% so far this year and set for its worst year since 2003, the dollar was expected to weaken further as renewed concern about Fed independence comes amid increased expectations for rate cuts and a looming July 9 deadline for trade agreements.
~ Reuters, June 26, 2025
The penny, like gold, is a monetary version of the boy who points out that the emperor has no clothes. The penny’s recent performance shows the broader costs of the Federal Reserve’s enabling massive budget deficits by increasing the money supply. Gold shows this more clearly because precious metals are driven more by broader economic expectations than industrial supply and demand.
~ The Wall Street Journal, June 4, 2025
In our last discussion, we spent some time reviewing the use of tariffs in the 19th century. Since contemporary discussions of tariffs usually begin and end with the Smoot-Hawley Tariff Act of 1930, there is a tendency to view tariffs myopically through the lens of the Great Depression. The beggar-thy-neighbor trade policies of the early 1930s certainly played a part in the global economic collapse during those years. However, there were other factors, many of them unrelated to tariffs and trade, which also contributed to that depression. This makes direct comparisons problematic.
In light of the association with the Great Depression, an awareness of the broader history of our use of tariffs – from the 1790s all the way through to the 1930s – can provide a more comprehensive appreciation of the potential outcomes from the resurrection of these policies.
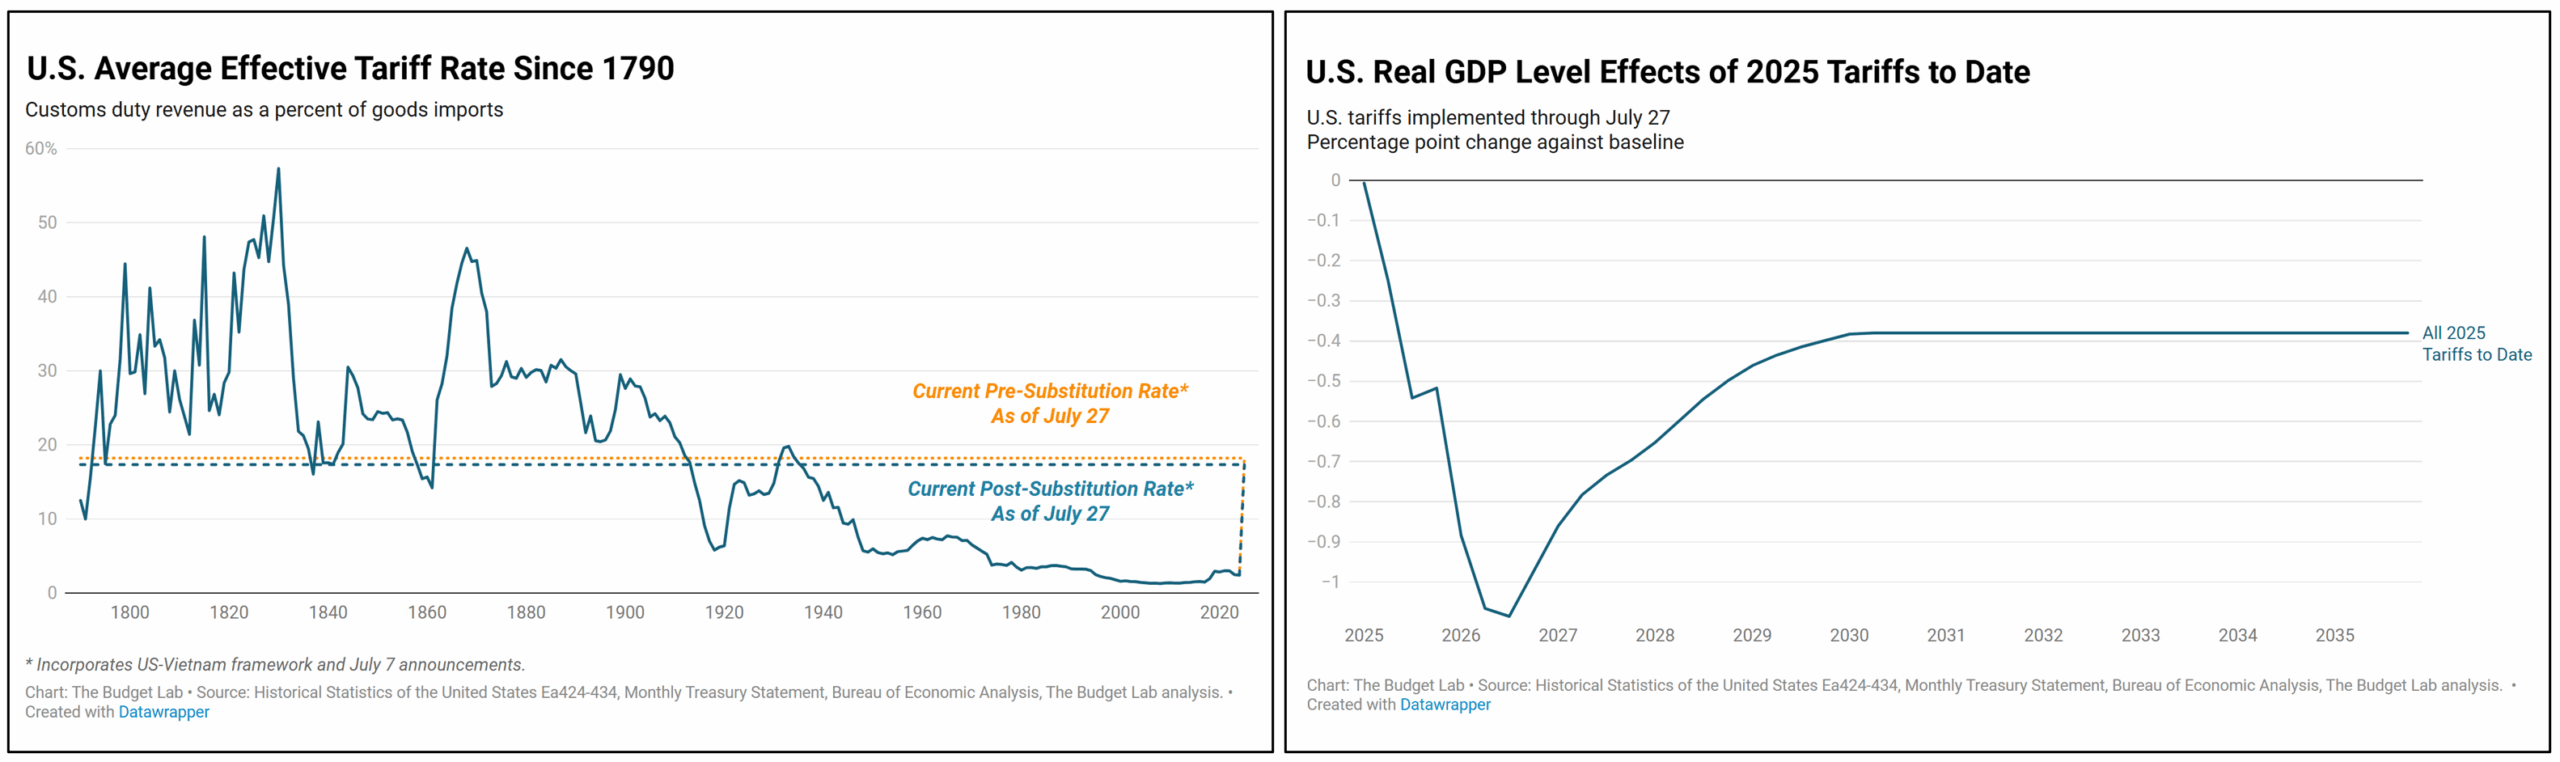
Yet while the return of tariffs does not necessarily mean a return to the 1930s, it does portend a return to an earlier time, a time when barriers to global trade were higher than they have been in recent decades. The tariff rates which were announced in April would have increased the average effective tariff rate for all imports into the U.S. to the highest level since the late 1800s. The adjustments since then have reduced the average effective tariff rate from its highest proposed levels, but it remains higher than at any other time in the post-war era. If such rates become the norm, it would be a sign that the trend toward globalization that has defined the post-war era may be coming to an end.
As was the case with tariffs in the 19th century, the primary reasons behind the current push toward higher tariffs appear rooted in two main areas: sheltering and/or reviving domestic industry, and generating revenue for the federal government.
The merits of the impact of the return of tariffs on the first area – sheltering and reviving domestic industry – has been a hotly debated topic this year. The Wall Street Journal recently lamented: “A generation ago conventional wisdom held that as China liberalized, its economy would come to resemble America’s. Instead, capitalism in America is starting to look like China.” The article went on to criticize how the U.S. economy is beginning to look like state capitalism, in which the not-so-invisible hand of government guides decisions that would normally be left to private enterprise – such as determining where to produce goods, who to employ in making those goods, and what to charge for those goods.
Amid headlines of the federal government working out deals with specific companies for revenue sharing agreements, tariff breaks in lieu of investment commitments, and even board appointments in exchange for takeover approvals (in the case of U.S. Steel), this year has certainly witnessed a more direct government involvement in business. At the same time, while this more direct involvement by the government may mark a pivot away from laissez-faire, it would also mark a return to policies which were commonly used throughout the first half of our country’s history. In other words, our economy may not be starting to resemble China’s economy, as The Wall Street Journal fears, as much as it may have started to revert back toward 19th century American protectionism.
Beyond the political debate, assessing the impact of tariffs on the real economy and financial markets is more important for our purposes. In that spirit, the San Francisco branch of the Federal Reserve released a study summarizing its estimates of the impact tariffs may have on employment, including not only the numbers of jobs in various sectors, but also the total contribution of those jobs to gross domestic product (GDP). The results of the report are highlighted in the charts below:
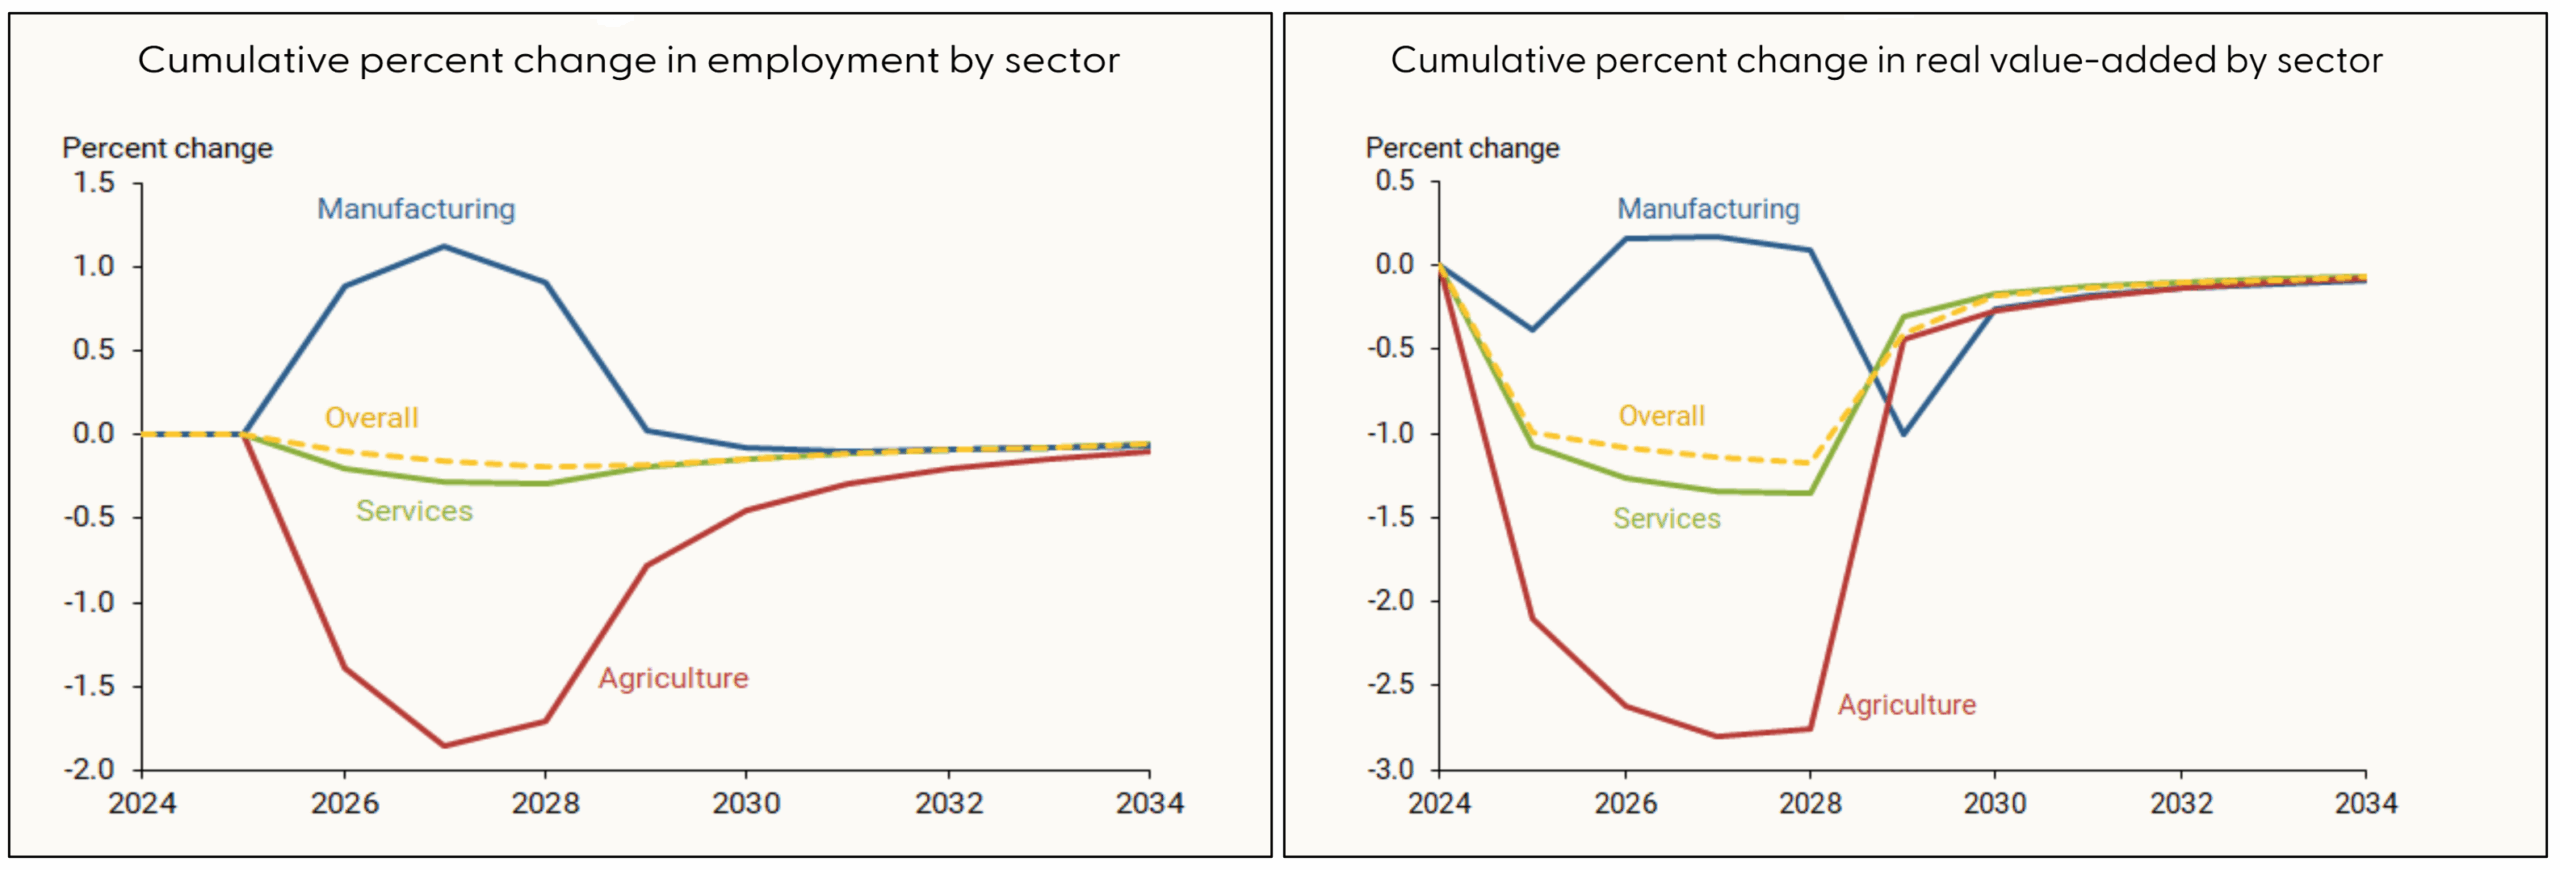
Ostensibly, the primary goal behind most of the tariffs that have been proposed or enacted is to revive domestic manufacturing. As you can see in the chart above, tariffs can help achieve that goal: the estimated change in manufacturing employment (on the left) and manufacturing value-added (on the right) from the tariffs enacted thus far is a net positive one. As happened in the 19th century, increasing the prices for imported goods via tariffs can encourage development of local supplies of those goods, and the impact of goods tariffs in the 21st century will likely be similar.
However, there will be a cost associated with gains in manufacturing employment that come from tariffs. That cost will be felt in several areas, two of which are also highlighted in the above charts. Service and agriculture employment will likely fall as a result of higher tariffs, and these impacts will likely be strong enough to result in a decline in overall employment.
The San Francisco Federal Reserve summarized its findings thusly (bold has been added):
[T]he changes that emerge following tariff increases are driven by a variety of forces. First, there is a general decrease in demand due to the fall in spending power when more people are out of work, as shown by the decline in overall employment. Second, foreign inputs become more expensive due to the tariffs, which makes production less efficient and decreases labor demand. Third, there is an expenditure-switching effect: imports from other countries become more expensive and tend to be substituted with domestic production, increasing labor demand in net-importing sectors.
The United States is a net importer for manufacturing, so the expenditure-switching effect dominates the other two effects in this sector, and manufacturing employment increases up to 1.1%, reaching a peak in 2027. By contrast, the United States is a net exporter of services and has a roughly balanced trade in agriculture. As a result, the expenditure-switching effect is less powerful in those sectors. The other effects – the fall in aggregate demand and the increase in input costs – dominate, and employment falls 0.3% for services and 1.8% in agriculture.
Mirroring the gain in manufacturing jobs, and the decline in the number of jobs in services and agriculture, tariffs will likely have a similar impact on the real, inflation-adjusted contribution of total wages to GDP. Overall, while tariffs will likely induce an increase in the real value of total manufacturing wages in the U.S., there will likely be a decrease in the real value of total hours worked in services and agriculture. The latter decreases will most likely be large enough to cause a decline in the real, inflation-adjusted value of the total wages earned by employment.
Again, from the San Francisco Fed (bold has been added):
Real value-added in our framework is measured by total labor compensation – wages times hours worked – in dollars divided by overall prices. Real manufacturing value-added increases up to 0.2%, while real service value-added decreases as much as 1.3% and real agriculture value-added decreases as much as 2.8%. Overall, real value-added falls by as much as 1.2%. The decline in overall real value-added through 2028 is partially offset by the increase in revenue rebates from tariffs. Therefore, real income – which coincides with real GDP and includes tariff revenue – only falls around 0.4% by 2028.
As we discussed last quarter, while tariffs in the 19th century were successful in protecting and nourishing the early development of various industries in the U.S., they were gradually abandoned after it became clear that the overall economy would benefit if the high prices sheltering favored industries were subjected to market pricing. Policy makers eventually realized that the lower prices from eliminating tariffs would widely benefit the majority producers and consumers, while at the same time fueling productivity and driving innovation. Instead of maintaining a statutory barrier favoring the few, including those who became the titans of protected industries like Andrew Carnegie and John D. Rockefeller, eliminating tariffs would favor the many.
The reintroduction of tariffs steers the U.S. economy back toward protecting the few, and there will likely be costs associated with that pivot – including higher prices for producers and consumers, and a decline in overall employment, relative to a non-tariff baseline. However, the benefit will be that manufacturing employment and total manufacturing wages will likely increase relative to what they would have been otherwise.
The merits of the return of tariffs in the second area mentioned above – generating revenue for the federal government – are already starting to be seen. In July, the total revenue generated from tariffs rose to $28 billion, a 273% increase from July 2024. So far in the current fiscal year, revenue generated by tariffs has reached $142 billion. Although many of the proposed tariff rates remain paused while bilateral trade agreements are negotiated, the tariffs implemented thus far have already begun to generate revenue for the federal government.
The ultimate source of the increased revenue generated by tariffs is hinted at in the last sentence of the San Francisco Federal Reserve’s summary above. While overall real value-added from total employment may fall 1.2%, the San Francisco Fed forecasts revenue generated from tariffs may reduce that loss of national income to only 0.4% of GDP. The net 0.8% of GDP recovered from tariffs, amounting to $240 billion of revenue, will flow to the federal government. Thus, while tariff revenue will be paid by importers, the ultimate cost of that revenue will come in the form of a 1.2%-of-GDP ($360 billion) net loss in total wage income, borne in services and agriculture.
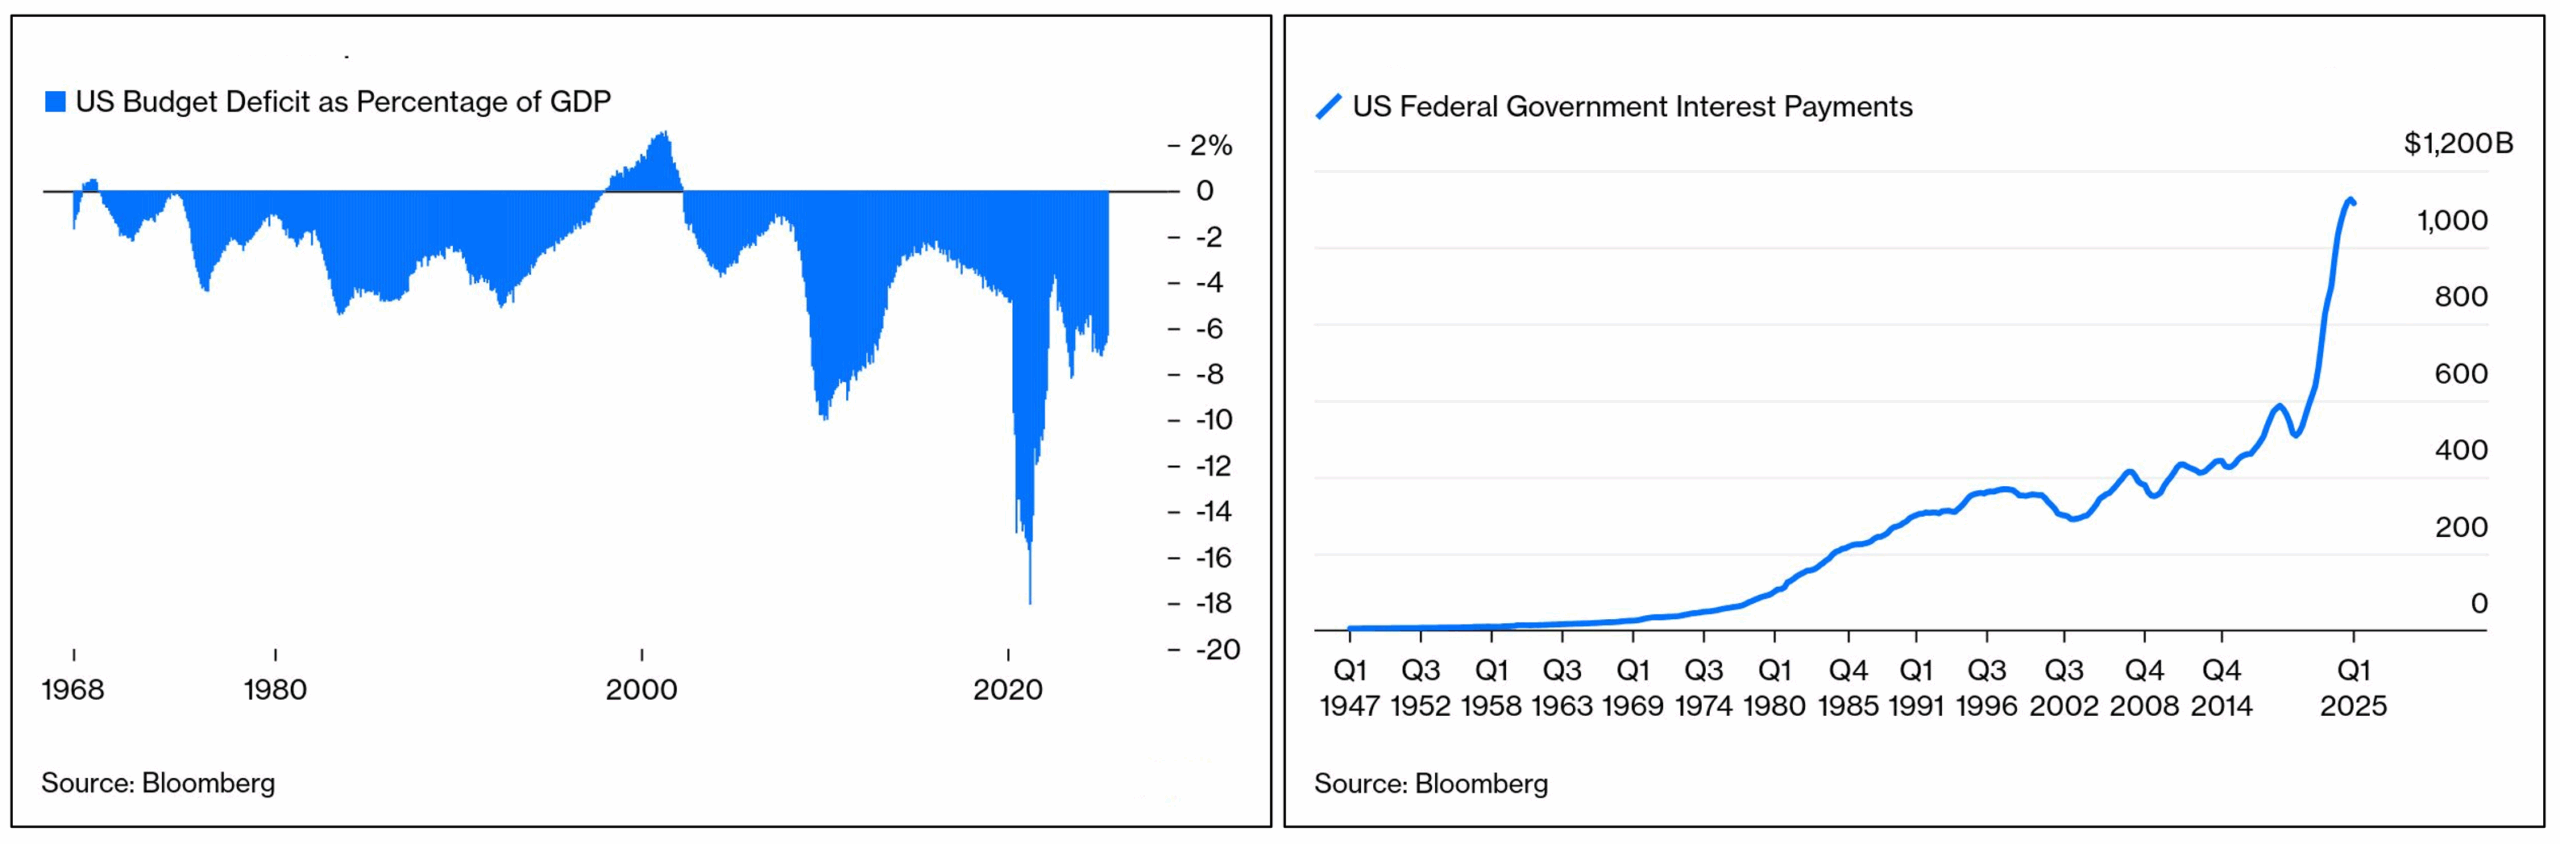
There may be additional costs as well. While tariffs will likely increase manufacturing employment and generate new revenue for the federal government, we will have to wait and see how the total cost of these policies comes to bear on the economy and the government’s budget over time. Tariff revenue increased substantially in July versus a year earlier, but the government still borrowed 10% more in July 2025 than it did in July 2024. The federal government has borrowed $1.63 trillion so far this fiscal year, and one of the main drivers behind the deficits has been an increase in interest cost – and tariff-induced inflation could exacerbate this trend.
There are strong signs that the markets are now paying close attention to the deteriorating federal budget trajectory, and to the impact all of the policy changes being enacted and pursued will have on economic growth and inflation in the years ahead. The clearest among these signs was a 10% decline in the trade-weighted Dollar Index during the first and second quarters.
There were signs in the bond market as well. Contrary to conventional cyclical wisdom, long-dated Treasury yields rose during the first half of the year, even as economic and employment growth slowed. The U.S. economy grew at an annualized rate of 1.25% in the first and second quarter, a sharp slowdown from the 2.8% rate in 2024. Accompanying that growth slowdown was a slowdown in job growth, especially in the months following the tariff announcements. This deterioration in growth would typically result in falling long-term Treasury yields, as the markets priced in slower growth and lower inflation. Instead, the 30-Year Treasury yield rose above 5% in May and again in July, and it remains near that level early in the third quarter.
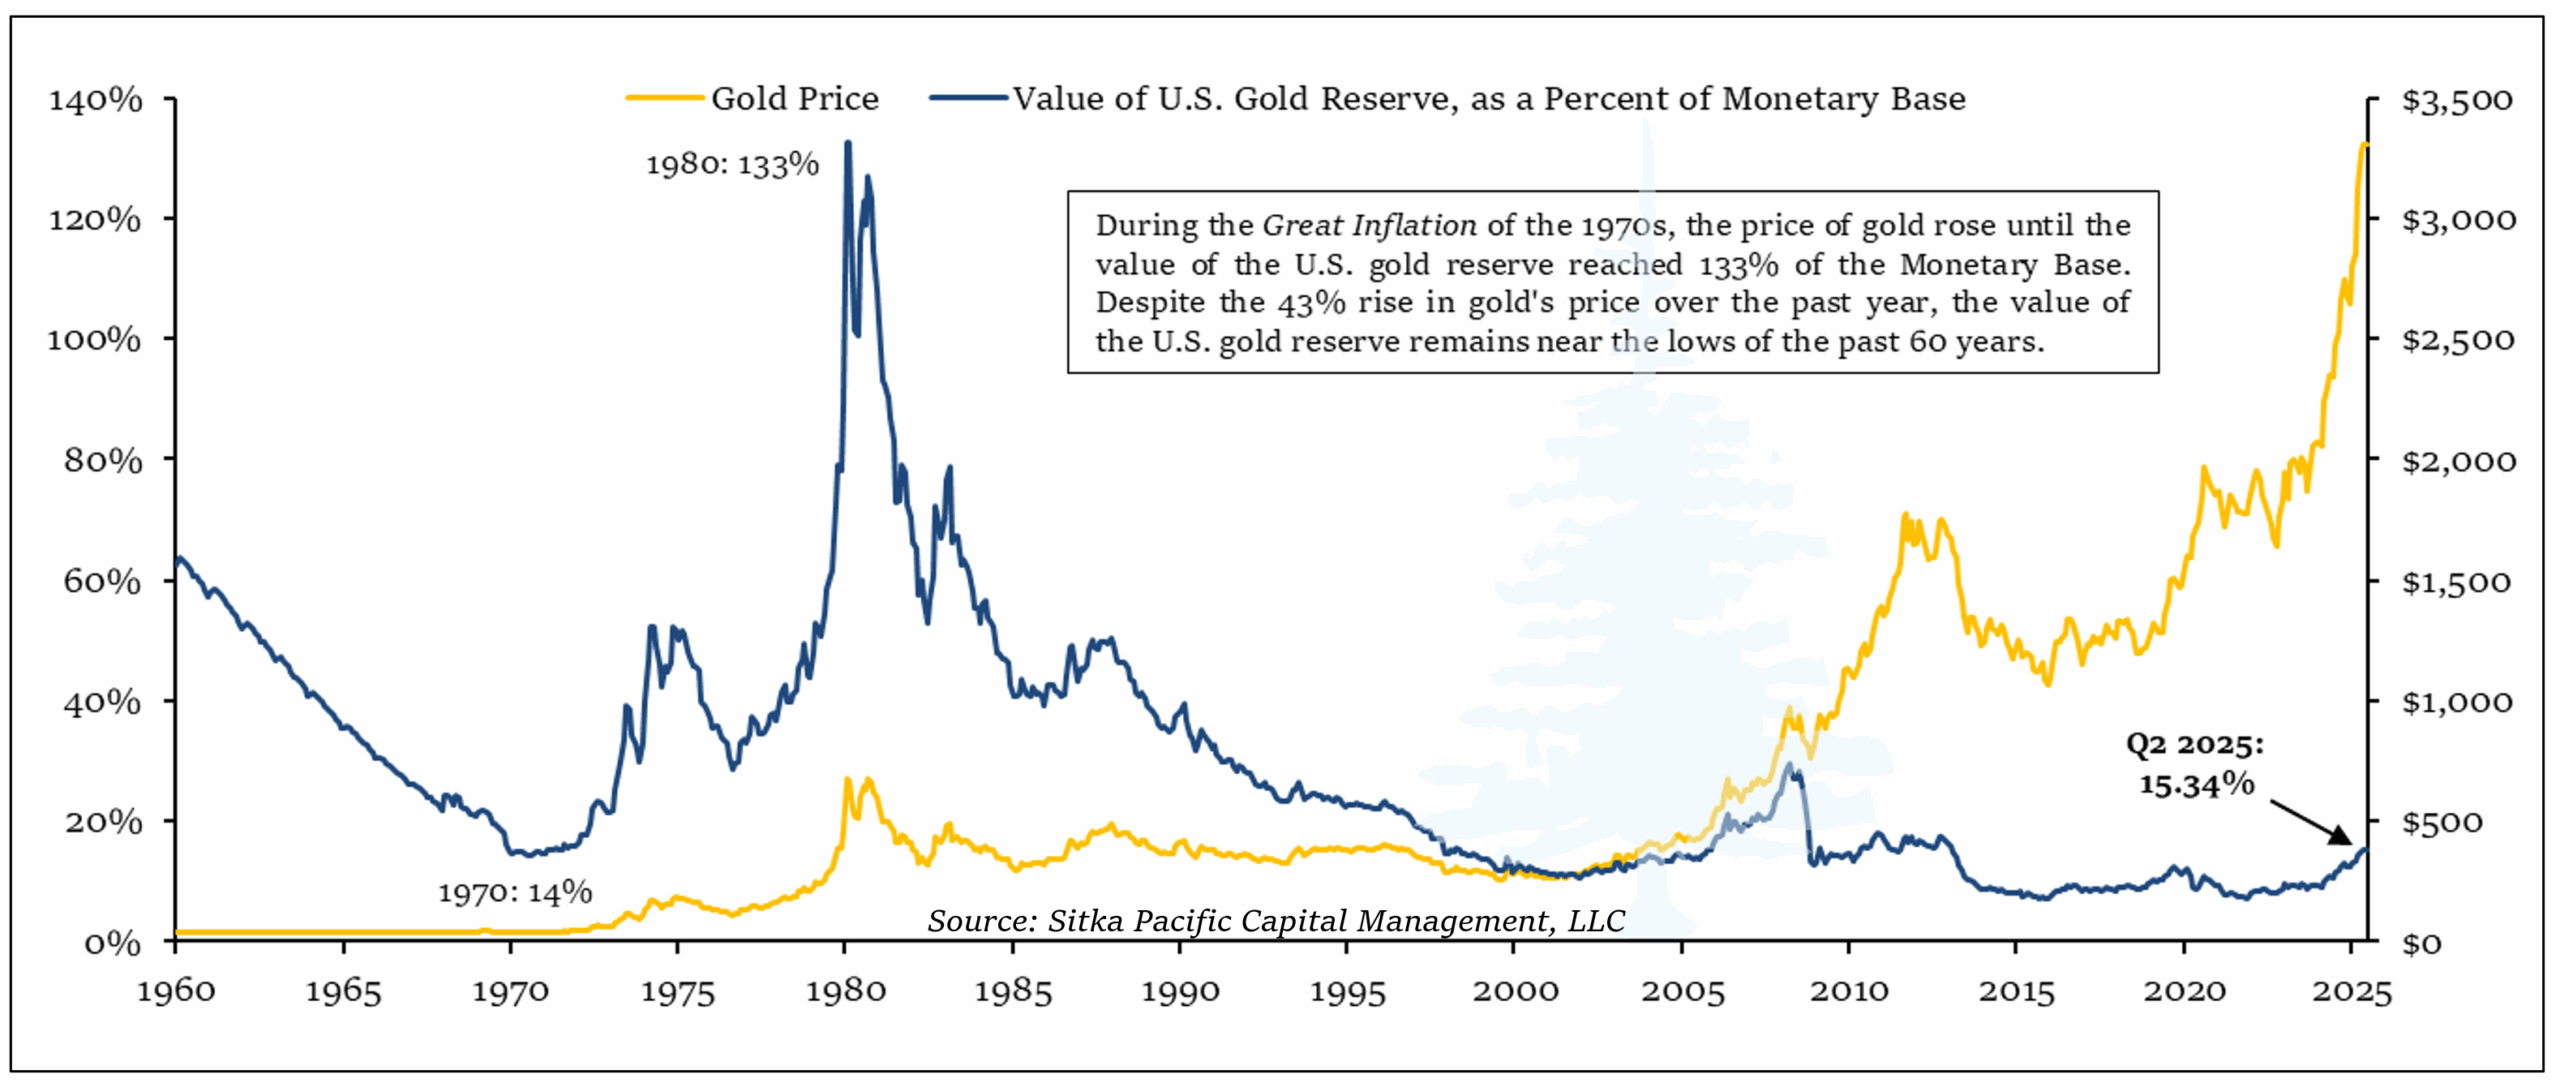
Finally, it would be remiss to not mention the trend below in any discussion of how the market is paying attention to the deteriorating federal budget. During the first half of 2025, the price of gold rose 26% and the price of silver rose 25%. Although precious metals have faded from the headlines in recent months, the gains in precious metals over the past year mark a decisive acceleration that suggests markets are reaching some conclusions about the outlook for inflation and the value of the dollar in the years ahead.
In a sign of these times, the U.S. Mint announced in May that it would cease minting pennies in 2026. When the penny was first introduced in 1793, it cost less than 1 cent to mint each pure copper penny. Today it costs 3.69 cents to make each penny, which have been composed of 97.5% zinc and 2.5% copper plating since 1982. It would cost about 14 cents to make a pure copper penny today, which is indicative of the long-term cost of the Federal Reserve’s price stability mandate. After decades of political pressure for short-term stability and easier monetary policy, we are seeing the cumulative impact on the dollar’s falling price in gold terms, and the looming demise of the penny.
* * *
In the first quarter of this year, we reviewed the events that led up to the recession and bear market in 2007 and 2008. One of the underlying themes in that discussion was how the monetary policy changes in 2004 and 2005 preceded the yield curve inversion in 2006, and how those events preceded the peak in the equity market in late 2007 and subsequent credit crisis in 2008. It was a progression lasting more than five years, and each step of the way came with its own identifying features.
One of those identifying features was the euphoria in the equity market in late 2007, once the market began to price in rate cuts by the Federal Reserve. The S&P 500 reached its highest valuation in October 2007 as the yield curve inversion began to unwind. It was a classic example of the type of exuberance which often marks the peak of a market cycle.
At the beginning of the current quarter, the S&P 500 reached a valuation milestone: it rose above its high-water mark in 2021 to reach the second highest cyclically adjusted price-to-earnings ratio on record. Only the peak of the tech bubble in 1999 and 2000 has seen a higher CAPE valuation than today. Undoubtably, this high valuation is a triumph of U.S. exceptionalism, as the market gains have been largely fueled by the large Magnificent Seven technology companies. Without the development and release of generative A.I. tools, it is unlikely this valuation milestone would have been achieved in the face of the rising interest rates and bond yields over the past few years.
Yet while the U.S. technology sector clearly represents a triumph of U.S. exceptionalism, it is also clear the first half of 2025 witnessed an erosion of the exorbitant privilege the U.S. dollar has long enjoyed. This erosion has turned gains in the U.S. equity market this year into currency-adjusted losses for foreign investors, and it is altering the global investment landscape and the flow of funds. Amid the simultaneous triumph and erosion of U.S. exceptionalism, opportunities outside the richly valued S&P 500 appear all the more attractive.
* * *
The preceding is from our 3rd Quarter letter to clients. If you would like to schedule a consultation to review your portfolio, visit Getting Started.
The content of this article is provided as general information and is for educational purposes only. It is not intended to provide investment or other advice. This material is not to be construed as a recommendation or solicitation to buy or sell any security, financial product, instrument or to participate in any particular trading strategy. Not all securities, products or services described are available in all countries, and nothing herein constitutes an offer or solicitation of any securities, products or services in any jurisdiction where their offer or sale is not qualified or exempt from registration or otherwise legally permissible.
Although the material herein is based upon information considered reliable and up-to-date, Sitka Pacific Capital Management, LLC does not assure that this material is accurate, current, or complete, and it should not be relied upon as such. Content in this article may not be copied, reproduced, republished, or posted, in whole or in part, without prior written consent — which is usually gladly given, as long as its use includes clear and proper attribution. Contact us for more information.
© Sitka Pacific Capital Management, LLC
The Triumph and Erosion of Exceptionalism
3rd Quarter, 2025
A battered dollar is taking another beating as investors, unnerved by fresh signs of an erosion in U.S. central bank independence, waste no time in pushing the greenback back to its lowest levels in over three years.
Down 10% so far this year and set for its worst year since 2003, the dollar was expected to weaken further as renewed concern about Fed independence comes amid increased expectations for rate cuts and a looming July 9 deadline for trade agreements.
~ Reuters, June 26, 2025
The penny, like gold, is a monetary version of the boy who points out that the emperor has no clothes. The penny’s recent performance shows the broader costs of the Federal Reserve’s enabling massive budget deficits by increasing the money supply. Gold shows this more clearly because precious metals are driven more by broader economic expectations than industrial supply and demand.
~ The Wall Street Journal, June 4, 2025
In our last discussion, we spent some time reviewing the use of tariffs in the 19th century. Since contemporary discussions of tariffs usually begin and end with the Smoot-Hawley Tariff Act of 1930, there is a tendency to view tariffs myopically through the lens of the Great Depression. The beggar-thy-neighbor trade policies of the early 1930s certainly played a part in the global economic collapse during those years. However, there were other factors, many of them unrelated to tariffs and trade, which also contributed to that depression. This makes direct comparisons problematic.
In light of the association with the Great Depression, an awareness of the broader history of our use of tariffs – from the 1790s all the way through to the 1930s – can provide a more comprehensive appreciation of the potential outcomes from the resurrection of these policies.
Yet while the return of tariffs does not necessarily mean a return to the 1930s, it does portend a return to an earlier time, a time when barriers to global trade were higher than they have been in recent decades. The tariff rates which were announced in April would have increased the average effective tariff rate for all imports into the U.S. to the highest level since the late 1800s. The adjustments since then have reduced the average effective tariff rate from its highest proposed levels, but it remains higher than at any other time in the post-war era. If such rates become the norm, it would be a sign that the trend toward globalization that has defined the post-war era may be coming to an end.
As was the case with tariffs in the 19th century, the primary reasons behind the current push toward higher tariffs appear rooted in two main areas: sheltering and/or reviving domestic industry, and generating revenue for the federal government.
The merits of the impact of the return of tariffs on the first area – sheltering and reviving domestic industry – has been a hotly debated topic this year. The Wall Street Journal recently lamented: “A generation ago conventional wisdom held that as China liberalized, its economy would come to resemble America’s. Instead, capitalism in America is starting to look like China.” The article went on to criticize how the U.S. economy is beginning to look like state capitalism, in which the not-so-invisible hand of government guides decisions that would normally be left to private enterprise – such as determining where to produce goods, who to employ in making those goods, and what to charge for those goods.
Amid headlines of the federal government working out deals with specific companies for revenue sharing agreements, tariff breaks in lieu of investment commitments, and even board appointments in exchange for takeover approvals (in the case of U.S. Steel), this year has certainly witnessed a more direct government involvement in business. At the same time, while this more direct involvement by the government may mark a pivot away from laissez-faire, it would also mark a return to policies which were commonly used throughout the first half of our country’s history. In other words, our economy may not be starting to resemble China’s economy, as The Wall Street Journal fears, as much as it may have started to revert back toward 19th century American protectionism.
Beyond the political debate, assessing the impact of tariffs on the real economy and financial markets is more important for our purposes. In that spirit, the San Francisco branch of the Federal Reserve released a study summarizing its estimates of the impact tariffs may have on employment, including not only the numbers of jobs in various sectors, but also the total contribution of those jobs to gross domestic product (GDP). The results of the report are highlighted in the charts below:
Ostensibly, the primary goal behind most of the tariffs that have been proposed or enacted is to revive domestic manufacturing. As you can see in the chart above, tariffs can help achieve that goal: the estimated change in manufacturing employment (on the left) and manufacturing value-added (on the right) from the tariffs enacted thus far is a net positive one. As happened in the 19th century, increasing the prices for imported goods via tariffs can encourage development of local supplies of those goods, and the impact of goods tariffs in the 21st century will likely be similar.
However, there will be a cost associated with gains in manufacturing employment that come from tariffs. That cost will be felt in several areas, two of which are also highlighted in the above charts. Service and agriculture employment will likely fall as a result of higher tariffs, and these impacts will likely be strong enough to result in a decline in overall employment.
The San Francisco Federal Reserve summarized its findings thusly (bold has been added):
[T]he changes that emerge following tariff increases are driven by a variety of forces. First, there is a general decrease in demand due to the fall in spending power when more people are out of work, as shown by the decline in overall employment. Second, foreign inputs become more expensive due to the tariffs, which makes production less efficient and decreases labor demand. Third, there is an expenditure-switching effect: imports from other countries become more expensive and tend to be substituted with domestic production, increasing labor demand in net-importing sectors.
The United States is a net importer for manufacturing, so the expenditure-switching effect dominates the other two effects in this sector, and manufacturing employment increases up to 1.1%, reaching a peak in 2027. By contrast, the United States is a net exporter of services and has a roughly balanced trade in agriculture. As a result, the expenditure-switching effect is less powerful in those sectors. The other effects – the fall in aggregate demand and the increase in input costs – dominate, and employment falls 0.3% for services and 1.8% in agriculture.
Mirroring the gain in manufacturing jobs, and the decline in the number of jobs in services and agriculture, tariffs will likely have a similar impact on the real, inflation-adjusted contribution of total wages to GDP. Overall, while tariffs will likely induce an increase in the real value of total manufacturing wages in the U.S., there will likely be a decrease in the real value of total hours worked in services and agriculture. The latter decreases will most likely be large enough to cause a decline in the real, inflation-adjusted value of the total wages earned by employment.
Again, from the San Francisco Fed (bold has been added):
Real value-added in our framework is measured by total labor compensation – wages times hours worked – in dollars divided by overall prices. Real manufacturing value-added increases up to 0.2%, while real service value-added decreases as much as 1.3% and real agriculture value-added decreases as much as 2.8%. Overall, real value-added falls by as much as 1.2%. The decline in overall real value-added through 2028 is partially offset by the increase in revenue rebates from tariffs. Therefore, real income – which coincides with real GDP and includes tariff revenue – only falls around 0.4% by 2028.
As we discussed last quarter, while tariffs in the 19th century were successful in protecting and nourishing the early development of various industries in the U.S., they were gradually abandoned after it became clear that the overall economy would benefit if the high prices sheltering favored industries were subjected to market pricing. Policy makers eventually realized that the lower prices from eliminating tariffs would widely benefit the majority producers and consumers, while at the same time fueling productivity and driving innovation. Instead of maintaining a statutory barrier favoring the few, including those who became the titans of protected industries like Andrew Carnegie and John D. Rockefeller, eliminating tariffs would favor the many.
The reintroduction of tariffs steers the U.S. economy back toward protecting the few, and there will likely be costs associated with that pivot – including higher prices for producers and consumers, and a decline in overall employment, relative to a non-tariff baseline. However, the benefit will be that manufacturing employment and total manufacturing wages will likely increase relative to what they would have been otherwise.
The merits of the return of tariffs in the second area mentioned above – generating revenue for the federal government – are already starting to be seen. In July, the total revenue generated from tariffs rose to $28 billion, a 273% increase from July 2024. So far in the current fiscal year, revenue generated by tariffs has reached $142 billion. Although many of the proposed tariff rates remain paused while bilateral trade agreements are negotiated, the tariffs implemented thus far have already begun to generate revenue for the federal government.
The ultimate source of the increased revenue generated by tariffs is hinted at in the last sentence of the San Francisco Federal Reserve’s summary above. While overall real value-added from total employment may fall 1.2%, the San Francisco Fed forecasts revenue generated from tariffs may reduce that loss of national income to only 0.4% of GDP. The net 0.8% of GDP recovered from tariffs, amounting to $240 billion of revenue, will flow to the federal government. Thus, while tariff revenue will be paid by importers, the ultimate cost of that revenue will come in the form of a 1.2%-of-GDP ($360 billion) net loss in total wage income, borne in services and agriculture.
There may be additional costs as well. While tariffs will likely increase manufacturing employment and generate new revenue for the federal government, we will have to wait and see how the total cost of these policies comes to bear on the economy and the government’s budget over time. Tariff revenue increased substantially in July versus a year earlier, but the government still borrowed 10% more in July 2025 than it did in July 2024. The federal government has borrowed $1.63 trillion so far this fiscal year, and one of the main drivers behind the deficits has been an increase in interest cost – and tariff-induced inflation could exacerbate this trend.
There are strong signs that the markets are now paying close attention to the deteriorating federal budget trajectory, and to the impact all of the policy changes being enacted and pursued will have on economic growth and inflation in the years ahead. The clearest among these signs was a 10% decline in the trade-weighted Dollar Index during the first and second quarters.
There were signs in the bond market as well. Contrary to conventional cyclical wisdom, long-dated Treasury yields rose during the first half of the year, even as economic and employment growth slowed. The U.S. economy grew at an annualized rate of 1.25% in the first and second quarter, a sharp slowdown from the 2.8% rate in 2024. Accompanying that growth slowdown was a slowdown in job growth, especially in the months following the tariff announcements. This deterioration in growth would typically result in falling long-term Treasury yields, as the markets priced in slower growth and lower inflation. Instead, the 30-Year Treasury yield rose above 5% in May and again in July, and it remains near that level early in the third quarter.
Finally, it would be remiss to not mention the trend below in any discussion of how the market is paying attention to the deteriorating federal budget. During the first half of 2025, the price of gold rose 26% and the price of silver rose 25%. Although precious metals have faded from the headlines in recent months, the gains in precious metals over the past year mark a decisive acceleration that suggests markets are reaching some conclusions about the outlook for inflation and the value of the dollar in the years ahead.
In a sign of these times, the U.S. Mint announced in May that it would cease minting pennies in 2026. When the penny was first introduced in 1793, it cost less than 1 cent to mint each pure copper penny. Today it costs 3.69 cents to make each penny, which have been composed of 97.5% zinc and 2.5% copper plating since 1982. It would cost about 14 cents to make a pure copper penny today, which is indicative of the long-term cost of the Federal Reserve’s price stability mandate. After decades of political pressure for short-term stability and easier monetary policy, we are seeing the cumulative impact on the dollar’s falling price in gold terms, and the looming demise of the penny.
* * *
In the first quarter of this year, we reviewed the events that led up to the recession and bear market in 2007 and 2008. One of the underlying themes in that discussion was how the monetary policy changes in 2004 and 2005 preceded the yield curve inversion in 2006, and how those events preceded the peak in the equity market in late 2007 and subsequent credit crisis in 2008. It was a progression lasting more than five years, and each step of the way came with its own identifying features.
One of those identifying features was the euphoria in the equity market in late 2007, once the market began to price in rate cuts by the Federal Reserve. The S&P 500 reached its highest valuation in October 2007 as the yield curve inversion began to unwind. It was a classic example of the type of exuberance which often marks the peak of a market cycle.
At the beginning of the current quarter, the S&P 500 reached a valuation milestone: it rose above its high-water mark in 2021 to reach the second highest cyclically adjusted price-to-earnings ratio on record. Only the peak of the tech bubble in 1999 and 2000 has seen a higher CAPE valuation than today. Undoubtably, this high valuation is a triumph of U.S. exceptionalism, as the market gains have been largely fueled by the large Magnificent Seven technology companies. Without the development and release of generative A.I. tools, it is unlikely this valuation milestone would have been achieved in the face of the rising interest rates and bond yields over the past few years.
Yet while the U.S. technology sector clearly represents a triumph of U.S. exceptionalism, it is also clear the first half of 2025 witnessed an erosion of the exorbitant privilege the U.S. dollar has long enjoyed. This erosion has turned gains in the U.S. equity market this year into currency-adjusted losses for foreign investors, and it is altering the global investment landscape and the flow of funds. Amid the simultaneous triumph and erosion of U.S. exceptionalism, opportunities outside the richly valued S&P 500 appear all the more attractive.
* * *
The preceding is from our 3rd Quarter letter to clients. If you would like to schedule a consultation to review your portfolio, visit Getting Started.
The content of this article is provided as general information and is for educational purposes only. It is not intended to provide investment or other advice. This material is not to be construed as a recommendation or solicitation to buy or sell any security, financial product, instrument or to participate in any particular trading strategy. Not all securities, products or services described are available in all countries, and nothing herein constitutes an offer or solicitation of any securities, products or services in any jurisdiction where their offer or sale is not qualified or exempt from registration or otherwise legally permissible.
Although the material herein is based upon information considered reliable and up-to-date, Sitka Pacific Capital Management, LLC does not assure that this material is accurate, current, or complete, and it should not be relied upon as such. Content in this article may not be copied, reproduced, republished, or posted, in whole or in part, without prior written consent — which is usually gladly given, as long as its use includes clear and proper attribution. Contact us for more information.
© Sitka Pacific Capital Management, LLC
Investment Management
Before investing, we will discuss your goals and risk tolerances with you to see if a separately managed account at Sitka Pacific would be a good fit. To contact us for a free consultation, visit Getting Started.
Macro Value Monitor
To read a selection of recent client letters and be alerted when new letters are posted to our public site, visit Recent Client Letters.