
Investment Management
Macro Value Monitor

The Growing Apprehension of the Inflating Fiscal Put
August 8, 2023
For the years following the Lehman crisis, the Fed put was the norm. Exceptionally loose monetary policy ensured risk assets had a safety net. But central banks were unable to rehabilitate the real economy while governments kept their belts tight.
That belt began to loosen in the years leading up to the pandemic, and then snapped altogether during it. Fiscal and monetary policy were [then] working hand-in-glove…[and] the full force of monetary expansion was realized.
The pandemic and its effects have now largely faded, but the fiscal deficits remain. With economies now more reliant on government spending, and the electorate’s ever-higher expectations of what their governments should shield them from – job loss, ill health, high energy prices, even death – it is becoming increasingly difficult to see how sovereigns can rein deficits back in to pre-pandemic norms any time soon.
~ Simon White, Bloomberg, July 2023
The US was stripped of its top-tier sovereign credit rating by Fitch Ratings, echoing a move made more than a decade ago by S&P. The credit assessor downgraded the US from AAA, a ranking the nation has held at Fitch since at least 1994, according to data compiled by Bloomberg. The move comes in the wake of major political battles over the nation’s borrowing and repeated standoffs over raising the debt limit. While the most recent legislative impasse was resolved, it remains a potential issue of concern going forward.
“The rating downgrade of the United States reflects the expected fiscal deterioration over the next three years, a high and growing general government debt burden, and the erosion of governance relative to ‘AA’ and ‘AAA’ rated peers over the last two decades that has manifested in repeated debt limit standoffs and last-minute resolutions,” Fitch said in a statement.
~ Bloomberg, August 1, 2023

Time seems to pass ever faster as we get older, as silently as major paradigm shifts unfold.
Seven years ago, in an everything-but-the-kitchen-sink attempt to foment inflation, the Bank of Japan instituted what was then a radical new policy. Although it had held short-term interest rates at zero since 1999, and had joined the European Central Bank and the Federal Reserve in instituting quantitative easing in April 2013, in 2016 the Bank of Japan went two dramatic steps further than its western counterparts.
That January, the BOJ surprised markets by lowering short-term interest rates below zero, to -0.1%. Although negative rates had appeared briefly during crises, a major central bank had never intentionally lowered a policy rate below zero before. Then, in September, the BOJ went a step further and instituted a policy of Yield Curve Control (YCC), to pin the yields of long-term government bonds at zero.
These were unprecedented moves.
The introduction of YCC established a 0.5% range above and below zero for Japan’s 10-year bond yield to trade, and further, the BOJ pledged to buy an unlimited amount of bonds to maintain that range. The Japanese government’s 10-year bond yield had declined precipitously in response to the introduction of negative interest rates in January, and in the years that followed, it remained between +0.25% and -0.25% as the BOJ’s balance sheet swelled.
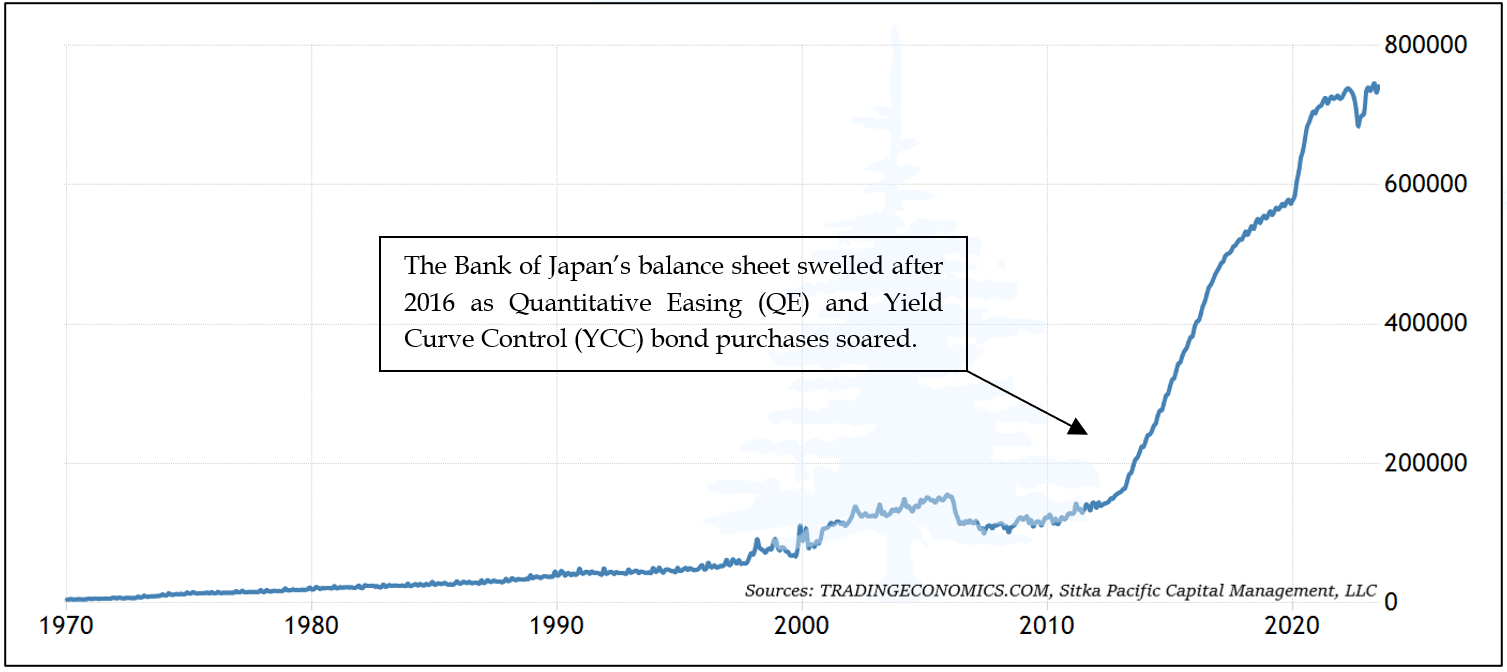
These twin policies, a short-term interest rate of negative 0.1%, and maintaining long-term bond yields in a tight range around zero, were instituted in response to the reemergence of the threat of deflation in Japan.
Japan had been struggling with “stable prices” since the early 1990s, and in 2016 consumer prices in Japan drifted lower and registered negative year-over-year readings yet again. At that time, Japan’s consumer price index had fluctuated near 100 for almost a quarter century, and the Bank of Japan, along with late Japanese Prime Minister Shinzo Abe, were determined to pursue policies that would finally reestablish an upward trend in prices.
Outside of Japan, other central banks were anxious about the threat of deflation as well. The Bank of Japan had pioneered the modern use of Quantitative Easing in the early 2000s, and when the financial crisis hit in 2008, the Federal Reserve immediately set about countering the threat of deflation with Japan’s monetary playbook. The Bank of England followed suit in March 2009 with its own QE program, and the European Central Bank began large-scale asset purchases that May.
In the years that followed, the ongoing fear of deleveraging-induced deflation drove the major central banks to expand their balance sheets in successive waves in amounts that were unimaginable only a few years earlier. As was highlighted in a chart last month, the collective monetary expansion resulted in a 4-fold increase in the assets held by the largest four central banks by 2018. Yet the ghosts of the Federal Reserve’s First Great Mistake remained so potent that the arrival of the Covid-19 pandemic provoked and additional response that was, by some measures, the most aggressive monetary expansion in history.
An irony of that moment in 2020 is there had been signs as early as 2015 that suggested the economic landscape was already shifting in ways that would eventually give central bankers what they had long sought.
Hints of that shift could be seen in the data.
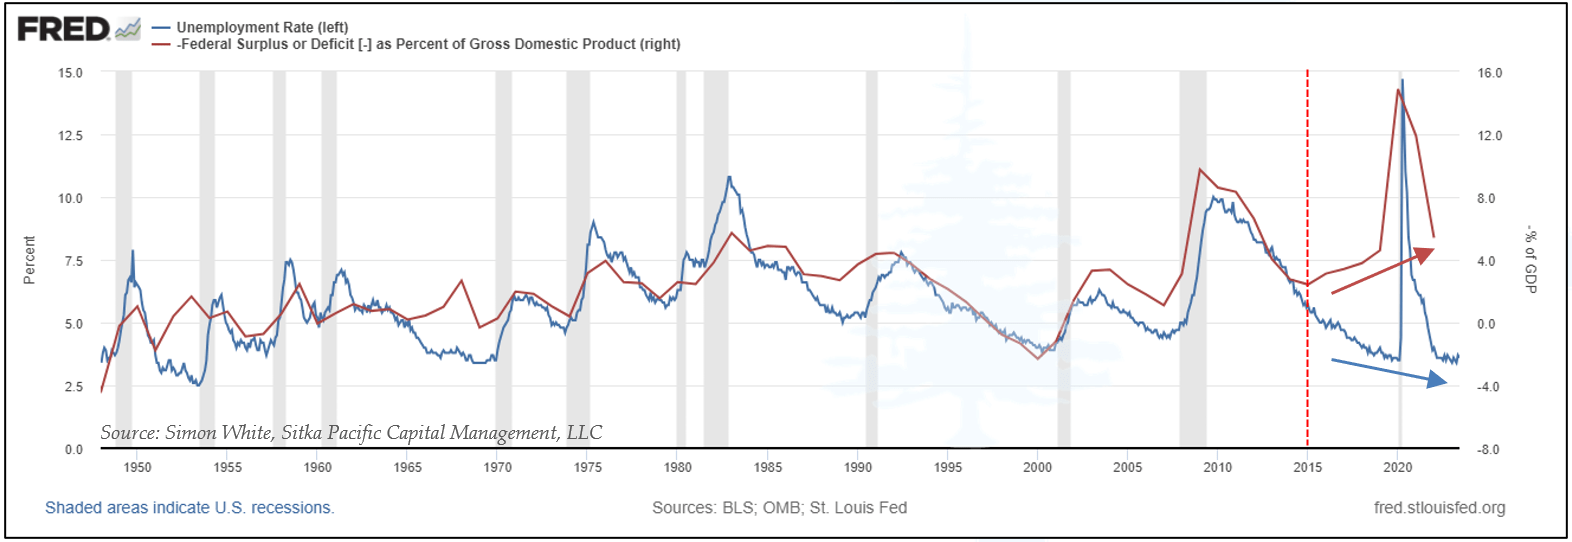
For most of the post-war era, the Federal budget deficit had fluctuated tightly in sync with the unemployment rate. There was no mystery in this correlation, as economic expansions usually resulted in growing tax collections and a decrease in unemployment benefits, and recessions usually reversed those trends. There were only two notable periods of divergence, and both were due to the financial demands of war: the Korean War in the 1950s, and the Vietnam War in the 1960s.
Yet in 2015, the Federal budget deficit began to increase even as the unemployment rate continued to fall, and it was the first time this happened without a major war. One of the primary reasons for this divergence was not from emergency wartime spending, or a recession, but from an increase in entitlement spending due to a much longer-term factor: demographics.
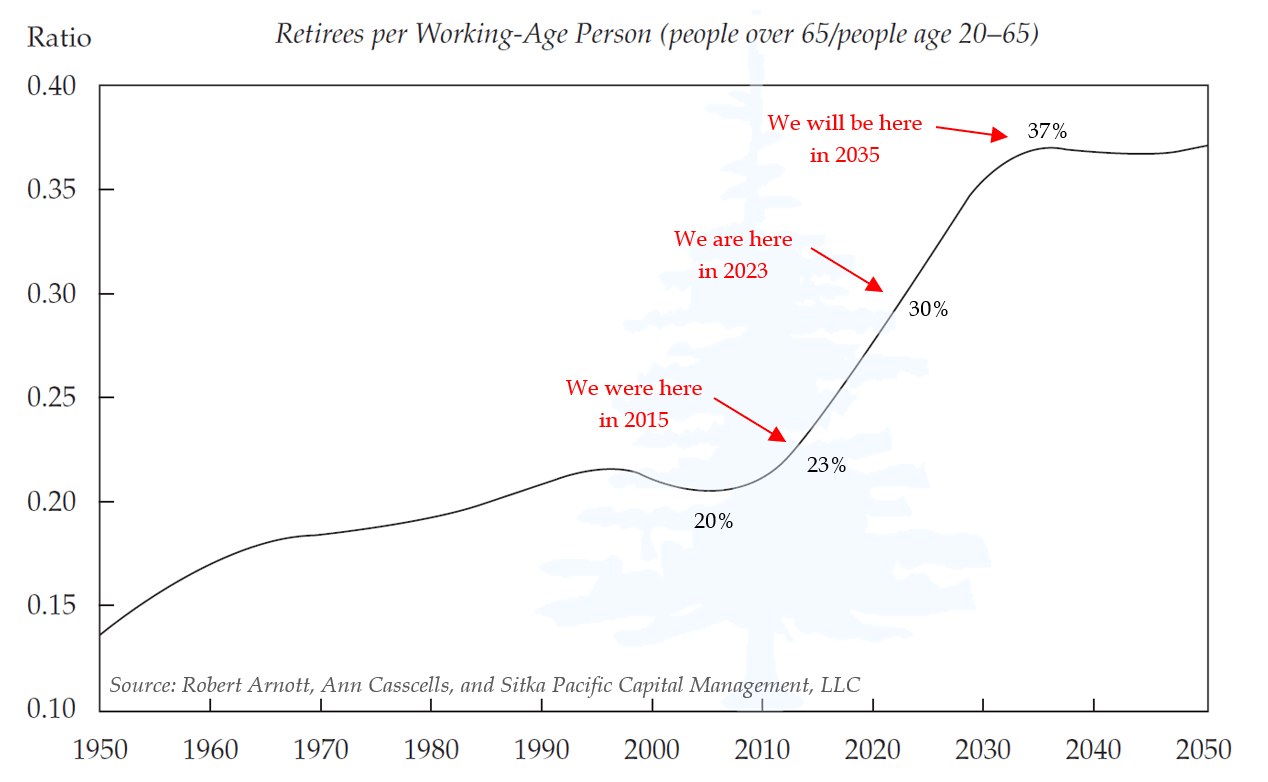
Twenty years ago, a paper published in the Financial Analysts Journal illustrated this single source of both the rising Federal deficit in recent years as well as the persistently low unemployment rate we are experiencing today. Entitled Demographics and Capital Market Returns, authors Robert Arnott and Ann Casscells detailed the approaching retirement wave that would begin coming onshore after 2010, and would eventually result in nearly twice the number of retirees per active workers than existed prior to 2010. The chart below from their article shows the progression of this retirement wave, with added annotations highlighting where we were, where we are, and where we will be in 2035:
While the Covid-19 pandemic scrambled many economic signals, as millions of workers stayed home, people at home spent less on services and more on goods, and monetary and fiscal stimulus flooded through the global economy, the underlying demographic trends which had been increasing the Federal budget deficit and lowering the unemployment rate began long for the pandemic hit.
As early as 2015, when the number of retirees had risen to 23% of the number of workers, the Federal deficit began to diverge from its close correlation with the unemployment rate. And today, with the number of retirees having risen to 30% of the workforce, worker shortages have become commonplace. As of the most recent employment report, there remain 3.8 million more job openings than those actively looking for work, the unemployment rate is at its lowest level since the 1960s, and average wages are rising above a 4% annual rate – the highest rate since 1982.
These tight labor conditions closely resemble one of the main conclusions from Demographics and Capital Market Returns. As Arnott and Casscells wrote in 2003:
Goods and services that retirees want—notably, in the health care, leisure, and service industries—probably will experience material inflation. And the higher costs should be reflected in higher wages, which will be needed to attract workers to the professions that serve the expanding population of retirees. Thus, the outcome could be a surge in real wages in the service sector and a continuing surge in medical costs.
These implications for…prospective inflation (stated here in their strongest terms) stem from the most basic law of economics: Supply and demand must match. Prices are set to equate supply and demand; no policy choices can alter this relationship. Retirees demand goods and services; workers supply them.
When should the impact of demographics…begin to take effect? The ratio of retirees to workers begins to rise in roughly 2008–2010 and starts to soar around 2015.
Just as Arnott and Casscells forecasted twenty years ago, the impact on the Federal deficit from this demographic shift began to show up in the economic data right on time, in 2015.
Yet because the Federal Reserve, the Bank of Japan, and other major central banks maintained interest rates at zero, or below, and continued to aggressively expand the base money supply through early 2022, they unwittingly set the stage for much stronger inflationary pivot than they bargained for.
* * *
They also set the stage for an historic pivot in interest costs, costs which are already impacting both the Federal Government and, as we will see in Part II, investors in U.S. corporations.
The fourteen years during which the major central banks held short-term interest rates near zero and suppressed long-term bond yields were an era of debt subsidization unlike any other in the post-war period. As Ronald Reagan once famously said, “If you want more of something, subsidize it.” The end result of this era of debt subsidization produced precisely that: government and corporate debt levels rose to new post-war highs by 2021.
Recognizing the fiscal implication of these high debt levels, the ratings firm Fitch stripped U.S. government debt of its triple-A rating on August 1st. In downgrading the U.S., Fitch cited factors related to “the expected fiscal deterioration over the next three years, a high and growing general government debt burden, and the erosion of governance relative to ‘AA’ and ‘AAA’ rated peers over the last two decades that has manifested in repeated debt limit standoffs and last-minute resolutions.” They continued:
We expect the general government (GG) deficit to rise to 6.3% of GDP in 2023, from 3.7% in 2022, reflecting cyclically weaker federal revenues, new spending initiatives and a higher interest burden…
Fitch forecasts a GG deficit of 6.6% of GDP in 2024 and a further widening to 6.9% of GDP in 2025. The larger deficits will be driven by weak 2024 GDP growth, a higher interest burden and wider state and local government deficits of 1.2% of GDP in 2024-2025 (in line with the historical 20-year average). The interest-to-revenue ratio is expected to reach 10% by 2025 (compared to 2.8% for the ‘AA’ median and 1% for the ‘AAA’ median) due to the higher debt level as well as sustained higher interest rates compared with pre-pandemic levels…
Over the next decade, higher interest rates and the rising debt stock will increase the interest service burden, while an aging population and rising healthcare costs will raise spending on the elderly absent fiscal policy reforms. The CBO projects that interest costs will double by 2033 to 3.6% of GDP. The CBO also estimates a rise in mandatory spending on Medicare and social security by 1.5% of GDP over the same period.
When interest rates were held near zero, and the yields of long-term government bonds were being suppressed as the Federal Reserve expanded its balance sheet, the rising interest cost of the inflating national debt was also suppressed. This resulted in a twofold benefit for the U.S. government’s budget that helped keep deficits under control:
- The interest paid to the share of bonds held by the Federal Reserve were refunded to Treasury.
- The lower rates kept the total annual interest cost lower than it would be otherwise.
The reversal of these benefits has been the other primary driver, along with demographics, of the expanding fiscal deficit since 2015.
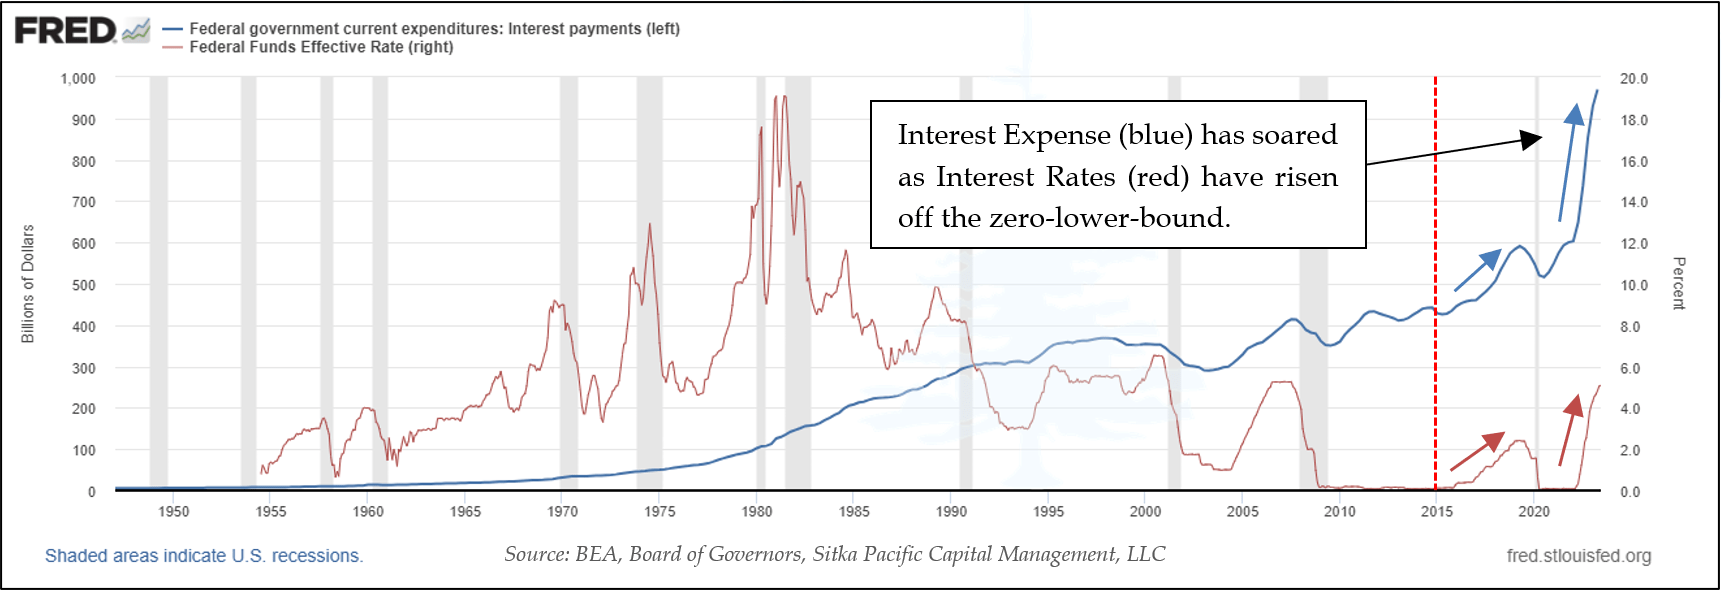
By the time the Federal Reserve has ended its third quantitative easing program and attempted to list interest rates off of the zero-lower-bound in 2016, the Federal government’s debt had climbed to $20 trillion. This was double the amount of debt the last time interest rates had been above zero, and the increasing cost of rising rates was immediately felt: annual interest expense rapidly expanded 39% to $591 billion in 2019, from $425 billion in 2015.
Yet that increased interest expense pales in comparison to the rise during next time the Federal Reserve began increasing interest rates in 2022. By then the Federal debt had climbed above $30 trillion, and the annual interest expense has rapidly climbed 62% to $970 billion from $600 billion:
The irony of the Federal Reserve’s campaign to rein in inflation by increasing interest rates is that rising interest rates and bond yields are simultaneously increasing the Federal deficit by hundreds of billions of dollars – which is inflationary. In other words, by their actions they are creating the very inflationary pressures they seek to dampen.
Last month, Bloomberg columnist Simon White cited Russell Napier’s characterization of this dynamic as a Treasury Put. Like the infamous Fed Put which Chairman Greenspan and Bernanke employed to keep financial markets afloat through economic turmoil, the Treasury Put is now keeping inflation aloft via inflating fiscal deficits, and it is effectively re-writing the narrative of what we can expect from the economy and the markets in the years to come.
As White pointed out last month, government fiscal deficits in nearly every major global economy have expanded since 2016, with the U.S. deficit ranking as the largest expansion as a percent of GDP. These deficit expansions amount to a global Fiscal Put. This Fiscal Put is set to continue inflating in the years ahead, as demographics and rising interest costs continue to swell deficits into the 2030s.
As we will see, this debt dynamic is not only the concern of debt ratings agencies, but it is the source of growing apprehension among investors as well, as unlike the Fed Put, an inflating Fiscal Put actively devalues financial markets.
* * *
The preceding article is part of our July/August letter to clients. To request a copy of the letter, or to request a complimentary consultation to review your investments, visit Getting Started.
The content of this document is provided as general information and is for educational purposes only. It is not intended to provide investment or other advice. This material is not to be construed as a recommendation or solicitation to buy or sell any security, financial product, instrument or to participate in any particular trading strategy. Not all securities, products or services described are available in all countries, and nothing herein constitutes an offer or solicitation of any securities, products or services in any jurisdiction where their offer or sale is not qualified or exempt from registration or otherwise legally permissible.
Although the material herein is based upon information considered reliable and up-to-date, Sitka Pacific Publishing, LLC does not assure that this material is accurate, current, or complete, and it should not be relied upon as such. Content in this document may not be copied, reproduced, republished, or posted, in whole or in part, without prior written consent from Sitka Pacific Publishing, LLC — which is usually gladly given, as long as its use includes clear and proper attribution. Contact us for more information.
© Sitka Pacific Publishing, LLC
The Growing Apprehension of the Inflating Fiscal Put
August 8, 2023
For the years following the Lehman crisis, the Fed put was the norm. Exceptionally loose monetary policy ensured risk assets had a safety net. But central banks were unable to rehabilitate the real economy while governments kept their belts tight.
That belt began to loosen in the years leading up to the pandemic, and then snapped altogether during it. Fiscal and monetary policy were [then] working hand-in-glove…[and] the full force of monetary expansion was realized.
The pandemic and its effects have now largely faded, but the fiscal deficits remain. With economies now more reliant on government spending, and the electorate’s ever-higher expectations of what their governments should shield them from – job loss, ill health, high energy prices, even death – it is becoming increasingly difficult to see how sovereigns can rein deficits back in to pre-pandemic norms any time soon.
~ Simon White, Bloomberg, July 2023
The US was stripped of its top-tier sovereign credit rating by Fitch Ratings, echoing a move made more than a decade ago by S&P. The credit assessor downgraded the US from AAA, a ranking the nation has held at Fitch since at least 1994, according to data compiled by Bloomberg. The move comes in the wake of major political battles over the nation’s borrowing and repeated standoffs over raising the debt limit. While the most recent legislative impasse was resolved, it remains a potential issue of concern going forward.
“The rating downgrade of the United States reflects the expected fiscal deterioration over the next three years, a high and growing general government debt burden, and the erosion of governance relative to ‘AA’ and ‘AAA’ rated peers over the last two decades that has manifested in repeated debt limit standoffs and last-minute resolutions,” Fitch said in a statement.
~ Bloomberg, August 1, 2023
Time seems to pass ever faster as we get older, as silently as major paradigm shifts unfold.
Seven years ago, in an everything-but-the-kitchen-sink attempt to foment inflation, the Bank of Japan instituted what was then a radical new policy. Although it had held short-term interest rates at zero since 1999, and had joined the European Central Bank and the Federal Reserve in instituting quantitative easing in April 2013, in 2016 the Bank of Japan went two dramatic steps further than its western counterparts.
That January, the BOJ surprised markets by lowering short-term interest rates below zero, to -0.1%. Although negative rates had appeared briefly during crises, a major central bank had never intentionally lowered a policy rate below zero before. Then, in September, the BOJ went a step further and instituted a policy of Yield Curve Control (YCC), to pin the yields of long-term government bonds at zero.
These were unprecedented moves.
The introduction of YCC established a 0.5% range above and below zero for Japan’s 10-year bond yield to trade, and further, the BOJ pledged to buy an unlimited amount of bonds to maintain that range. The Japanese government’s 10-year bond yield had declined precipitously in response to the introduction of negative interest rates in January, and in the years that followed, it remained between +0.25% and -0.25% as the BOJ’s balance sheet swelled.
These twin policies, a short-term interest rate of negative 0.1%, and maintaining long-term bond yields in a tight range around zero, were instituted in response to the reemergence of the threat of deflation in Japan.
Japan had been struggling with “stable prices” since the early 1990s, and in 2016 consumer prices in Japan drifted lower and registered negative year-over-year readings yet again. At that time, Japan’s consumer price index had fluctuated near 100 for almost a quarter century, and the Bank of Japan, along with late Japanese Prime Minister Shinzo Abe, were determined to pursue policies that would finally reestablish an upward trend in prices.
Outside of Japan, other central banks were anxious about the threat of deflation as well. The Bank of Japan had pioneered the modern use of Quantitative Easing in the early 2000s, and when the financial crisis hit in 2008, the Federal Reserve immediately set about countering the threat of deflation with Japan’s monetary playbook. The Bank of England followed suit in March 2009 with its own QE program, and the European Central Bank began large-scale asset purchases that May.
In the years that followed, the ongoing fear of deleveraging-induced deflation drove the major central banks to expand their balance sheets in successive waves in amounts that were unimaginable only a few years earlier. As was highlighted in a chart last month, the collective monetary expansion resulted in a 4-fold increase in the assets held by the largest four central banks by 2018. Yet the ghosts of the Federal Reserve’s First Great Mistake remained so potent that the arrival of the Covid-19 pandemic provoked and additional response that was, by some measures, the most aggressive monetary expansion in history.
An irony of that moment in 2020 is there had been signs as early as 2015 that suggested the economic landscape was already shifting in ways that would eventually give central bankers what they had long sought.
Hints of that shift could be seen in the data.
For most of the post-war era, the Federal budget deficit had fluctuated tightly in sync with the unemployment rate. There was no mystery in this correlation, as economic expansions usually resulted in growing tax collections and a decrease in unemployment benefits, and recessions usually reversed those trends. There were only two notable periods of divergence, and both were due to the financial demands of war: the Korean War in the 1950s, and the Vietnam War in the 1960s.
Yet in 2015, the Federal budget deficit began to increase even as the unemployment rate continued to fall, and it was the first time this happened without a major war. One of the primary reasons for this divergence was not from emergency wartime spending, or a recession, but from an increase in entitlement spending due to a much longer-term factor: demographics.
Twenty years ago, a paper published in the Financial Analysts Journal illustrated this single source of both the rising Federal deficit in recent years as well as the persistently low unemployment rate we are experiencing today. Entitled Demographics and Capital Market Returns, authors Robert Arnott and Ann Casscells detailed the approaching retirement wave that would begin coming onshore after 2010, and would eventually result in nearly twice the number of retirees per active workers than existed prior to 2010. The chart below from their article shows the progression of this retirement wave, with added annotations highlighting where we were, where we are, and where we will be in 2035:
While the Covid-19 pandemic scrambled many economic signals, as millions of workers stayed home, people at home spent less on services and more on goods, and monetary and fiscal stimulus flooded through the global economy, the underlying demographic trends which had been increasing the Federal budget deficit and lowering the unemployment rate began long for the pandemic hit.
As early as 2015, when the number of retirees had risen to 23% of the number of workers, the Federal deficit began to diverge from its close correlation with the unemployment rate. And today, with the number of retirees having risen to 30% of the workforce, worker shortages have become commonplace. As of the most recent employment report, there remain 3.8 million more job openings than those actively looking for work, the unemployment rate is at its lowest level since the 1960s, and average wages are rising above a 4% annual rate – the highest rate since 1982.
These tight labor conditions closely resemble one of the main conclusions from Demographics and Capital Market Returns. As Arnott and Casscells wrote in 2003:
Goods and services that retirees want—notably, in the health care, leisure, and service industries—probably will experience material inflation. And the higher costs should be reflected in higher wages, which will be needed to attract workers to the professions that serve the expanding population of retirees. Thus, the outcome could be a surge in real wages in the service sector and a continuing surge in medical costs.
These implications for…prospective inflation (stated here in their strongest terms) stem from the most basic law of economics: Supply and demand must match. Prices are set to equate supply and demand; no policy choices can alter this relationship. Retirees demand goods and services; workers supply them.
When should the impact of demographics…begin to take effect? The ratio of retirees to workers begins to rise in roughly 2008–2010 and starts to soar around 2015.
Just as Arnott and Casscells forecasted twenty years ago, the impact on the Federal deficit from this demographic shift began to show up in the economic data right on time, in 2015.
Yet because the Federal Reserve, the Bank of Japan, and other major central banks maintained interest rates at zero, or below, and continued to aggressively expand the base money supply through early 2022, they unwittingly set the stage for much stronger inflationary pivot than they bargained for.
* * *
They also set the stage for an historic pivot in interest costs, costs which are already impacting both the Federal Government and, as we will see in Part II, investors in U.S. corporations.
The fourteen years during which the major central banks held short-term interest rates near zero and suppressed long-term bond yields were an era of debt subsidization unlike any other in the post-war period. As Ronald Reagan once famously said, “If you want more of something, subsidize it.” The end result of this era of debt subsidization produced precisely that: government and corporate debt levels rose to new post-war highs by 2021.
Recognizing the fiscal implication of these high debt levels, the ratings firm Fitch stripped U.S. government debt of its triple-A rating on August 1st. In downgrading the U.S., Fitch cited factors related to “the expected fiscal deterioration over the next three years, a high and growing general government debt burden, and the erosion of governance relative to ‘AA’ and ‘AAA’ rated peers over the last two decades that has manifested in repeated debt limit standoffs and last-minute resolutions.” They continued:
We expect the general government (GG) deficit to rise to 6.3% of GDP in 2023, from 3.7% in 2022, reflecting cyclically weaker federal revenues, new spending initiatives and a higher interest burden…
Fitch forecasts a GG deficit of 6.6% of GDP in 2024 and a further widening to 6.9% of GDP in 2025. The larger deficits will be driven by weak 2024 GDP growth, a higher interest burden and wider state and local government deficits of 1.2% of GDP in 2024-2025 (in line with the historical 20-year average). The interest-to-revenue ratio is expected to reach 10% by 2025 (compared to 2.8% for the ‘AA’ median and 1% for the ‘AAA’ median) due to the higher debt level as well as sustained higher interest rates compared with pre-pandemic levels…
Over the next decade, higher interest rates and the rising debt stock will increase the interest service burden, while an aging population and rising healthcare costs will raise spending on the elderly absent fiscal policy reforms. The CBO projects that interest costs will double by 2033 to 3.6% of GDP. The CBO also estimates a rise in mandatory spending on Medicare and social security by 1.5% of GDP over the same period.
When interest rates were held near zero, and the yields of long-term government bonds were being suppressed as the Federal Reserve expanded its balance sheet, the rising interest cost of the inflating national debt was also suppressed. This resulted in a twofold benefit for the U.S. government’s budget that helped keep deficits under control:
- The interest paid to the share of bonds held by the Federal Reserve were refunded to Treasury.
- The lower rates kept the total annual interest cost lower than it would be otherwise.
The reversal of these benefits has been the other primary driver, along with demographics, of the expanding fiscal deficit since 2015.
By the time the Federal Reserve has ended its third quantitative easing program and attempted to list interest rates off of the zero-lower-bound in 2016, the Federal government’s debt had climbed to $20 trillion. This was double the amount of debt the last time interest rates had been above zero, and the increasing cost of rising rates was immediately felt: annual interest expense rapidly expanded 39% to $591 billion in 2019, from $425 billion in 2015.
Yet that increased interest expense pales in comparison to the rise during next time the Federal Reserve began increasing interest rates in 2022. By then the Federal debt had climbed above $30 trillion, and the annual interest expense has rapidly climbed 62% to $970 billion from $600 billion:
The irony of the Federal Reserve’s campaign to rein in inflation by increasing interest rates is that rising interest rates and bond yields are simultaneously increasing the Federal deficit by hundreds of billions of dollars – which is inflationary. In other words, by their actions they are creating the very inflationary pressures they seek to dampen.
Last month, Bloomberg columnist Simon White cited Russell Napier’s characterization of this dynamic as a Treasury Put. Like the infamous Fed Put which Chairman Greenspan and Bernanke employed to keep financial markets afloat through economic turmoil, the Treasury Put is now keeping inflation aloft via inflating fiscal deficits, and it is effectively re-writing the narrative of what we can expect from the economy and the markets in the years to come.
As White pointed out last month, government fiscal deficits in nearly every major global economy have expanded since 2016, with the U.S. deficit ranking as the largest expansion as a percent of GDP. These deficit expansions amount to a global Fiscal Put. This Fiscal Put is set to continue inflating in the years ahead, as demographics and rising interest costs continue to swell deficits into the 2030s.
As we will see, this debt dynamic is not only the concern of debt ratings agencies, but it is the source of growing apprehension among investors as well, as unlike the Fed Put, an inflating Fiscal Put actively devalues financial markets.
* * *
The preceding article is part of our July/August letter to clients. To request a copy of the letter, or to request a complimentary consultation to review your investments, visit Getting Started.
The content of this document is provided as general information and is for educational purposes only. It is not intended to provide investment or other advice. This material is not to be construed as a recommendation or solicitation to buy or sell any security, financial product, instrument or to participate in any particular trading strategy. Not all securities, products or services described are available in all countries, and nothing herein constitutes an offer or solicitation of any securities, products or services in any jurisdiction where their offer or sale is not qualified or exempt from registration or otherwise legally permissible.
Although the material herein is based upon information considered reliable and up-to-date, Sitka Pacific Publishing, LLC does not assure that this material is accurate, current, or complete, and it should not be relied upon as such. Content in this document may not be copied, reproduced, republished, or posted, in whole or in part, without prior written consent from Sitka Pacific Publishing, LLC — which is usually gladly given, as long as its use includes clear and proper attribution. Contact us for more information.
© Sitka Pacific Publishing, LLC
Investment Management
Before investing, we will discuss your goals and risk tolerances with you to see if a separately managed account at Sitka Pacific would be a good fit. To contact us for a free consultation, visit Getting Started.
Macro Value Monitor
To read a selection of recent client letters and be alerted when new letters are posted to our public site, visit Recent Client Letters.