
Investment Management
Macro Value Monitor

A Look at Prospective Market Returns Amid a New Era of Negative Real Rates
August 24, 2021
When I look out at what’s been going on the last six months, I see financial mania… The Fed, having pumped asset prices to historically high levels, doesn’t make me feel comfortable. I feel as anxious today as I’ve ever felt about the financial world because of my belief that the Fed has been pumping up asset prices in a way that is creating a bit of an illusion. I think the odds are now sort of one in three—very high—that we will look at this as an epic mistake and one of the great financial calamities of all time.
– Peter Fisher, Federal Reserve Bank of New York, 1985–2001
The Third Great Mistake means there is no longer an alternative to higher inflation, and there is also no pain-free way for monetary policy prevent inflation from spiraling higher than intended. It is reminiscent of the circumstances in the late 1960s, and it is fitting that financial markets appear to be in a similar position as well: interest rates are low, risk asset valuations are high, and there is a speculative fervor which has apparently concluded that the entire equity market is now a one decision investment.
– 2021 Annual Letter
One theme we have focused on in these letters over the past three years is what a transition into a regime of negative real interest rates looks and feels like, and the long-term consequences such a regime brings for the markets, and for investors. Since it has been fifty-five years since the last extended period of negative real interest rates began, and forty years since that period of negative interest rates ended, few investors today have any experience navigating such a market environment. For those who do, the memories are distant.
Most investors active in the markets today have only known a market environment defined by positive real rates of return on bonds and stocks, and over the past forty years this environment has been further defined by inflation rates that continuously trended lower. These are trends which supported ever higher valuations for risk assets, and ever longer effective durations for bonds, in a repeat of Warren Buffett’s Bountiful Triple Dip — one of the topics in this year’s annual letter. This regime had been firmly in place since the early 1980s, but it appears increasingly likely we may be witnessing its end. Evidence of the emergence of a new regime has been popping up all around the market landscape over the last year, and it can clearly be seen in the wake of the pivotal June meeting of the Federal Reserve’s rate-setting committee, the FOMC.
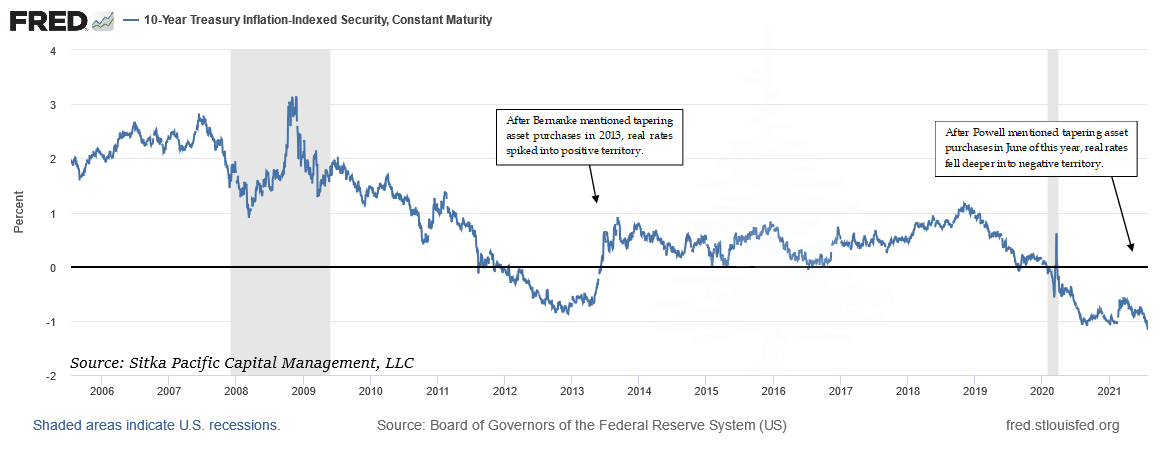
In the weeks after Fed Chair Jerome Powell confirmed that the FOMC had begun discussing at its June meeting when it might be appropriate to begin scaling back the pace of its extraordinary balance sheet expansion, yields on long-term Treasury yields continued a slide that had begun in May, when the first rumblings of a policy shift discussion were heard. At the same time Treasury yields fell, the market’s estimates of long-term inflation bucked the trend in yields and remained elevated, with the result being that expected real, inflation-adjusted yields on long-term Treasury securities declined to the lowest rates seen over the past year: the yield on the 10-Year Treasury Inflation-Protected security fell to a new low of -1.19%.
This reaction in the bond market was notable because it was the opposite of the reaction during the Taper Tantrum of 2013, when Treasury yields immediately shot higher when the possibility of tapering the pace of QE was first mentioned. This time, long-term Treasury yields tumbled, with the yield on the 30-Year Treasury bond falling as low as 1.78% in July.
As the entire Treasury yield curve descended below the Federal Reserve’s long-term inflation target of 2% in reaction to the tapering discussion, one conclusion the bond market appeared to reach was that any tapering of asset purchases would result in the Fed Funds rate remaining at zero for a longer period of time. With short-term interest rates at zero, and with the Fed’s $8.2 trillion balance sheet still expanding at a rate of $1.4 trillion a year, this is an extraordinary reaction. A nominal 10-Year Treasury yield trading near 1.2%, below the lowest levels seen in the last decade, suggests there may now be a new working definition of what tightening monetary policy effectively means.
Whereas before private sector deleveraging commenced it took an increase in real interest rates well above zero to cool the economy enough for inflation to subside (at the peak of the tech bubble, short-term interest rates peaked above 6%, which was 2.7% above the inflation rate at the time), the message from the bond market in recent months suggests that today’s modestly negative real interest rates alone will not be enough fuel for the Fed’s preferred inflation indexes to keep rising at a pace that meets the long-term inflation target of 2%. Ongoing quantitative easing may be needed as well.
In such a policy framework, tightening monetary policy would involve slowing the pace of QE until inflation rates and inflation expectations subside, then increasing the pace of QE to raise inflation rates and expectations when they fall too low, all while keeping short-term interest rates at zero — well below the inflation rate. While this prospect of perpetual quantitative easing coupled with negative real short-term interest rates may sound like a far-fetched scenario, it is just the outcome implied by the bond market in June and July, as the entire Treasury yield curve fell deeper into negative real territory when the prospect of tapering asset purchases appeared on the horizon.
The initial market reactions to the emergence of this new monetary regime — zero percent interest rates along with perpetual quantitative easing — have resulted in a long list of never-before-seen events and milestones over the past year, which have left many investors, even those with legendary careers spanning decades, scratching their heads. For just one example, in recent months the yield of some corporate bonds rated below investment grade has declined below the expected inflation rates over the bonds’ duration. While the idea of receiving a negative inflation-adjusted yield on the safest bonds came to be seen as somewhat rational after the chaos of the credit crisis, the desire to invest in risky corporate bonds with a negative expected real yield is more difficult for many experienced investors to fathom. Yet as bewildering as they seem, there is a common theme running through many of these incongruous events and milestones, and it is what we have focused on discussing in recent years: the transition to a negative real rate environment.
While the conversation amongst economists since June has been dominated by a high-frequency debate about when the Federal Reserve will begin tapering the rate of its asset purchases, and the subsequent timing of when short-term rates will cyclically lift off from zero, the market has been sending a different message which is far more consequential for investors. The core of this message is that in order to make meaningful progress toward achieving the goals of its dual mandate in the years ahead, the Federal Reserve is now in the awkward position of having to maintain short-term interest rates below the rate of inflation. And the primary reason the yields of the 10-Year Inflation-Indexed note (shown above) as well as the 30-Year Inflation-Indexed bond are trading in negative territory is that the market is expecting the Fed will remain in this awkward position for an extended period of time. A regime of negative inflation-adjusted interest rates and bond yields has arrived, and the effects of this phase shift have been propagating through the financial markets this year.
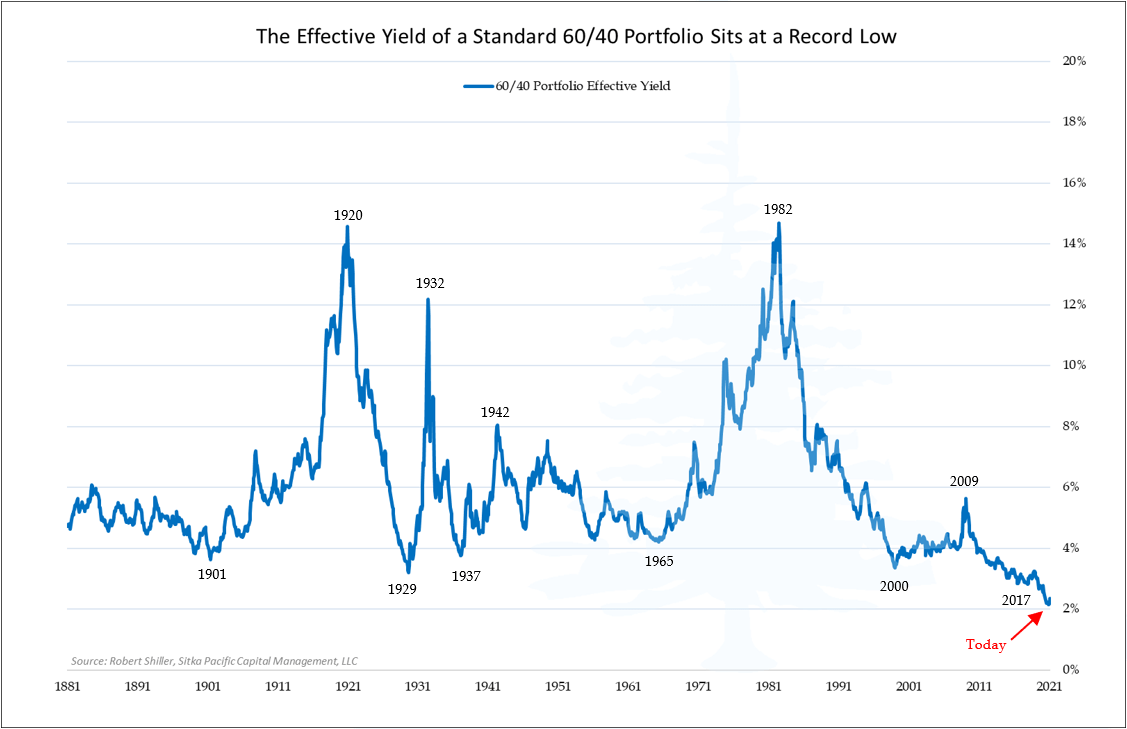
With Treasury bonds and more risky corporate bonds now offering a yield below the expected rate of inflation, investors have been scrambling for investments with a positive real yield. Yet as the equity market has climbed over the past year, its effective yield — the underlying cyclically adjusted earnings yield — has declined along with it, and this has left the standard 60/40 portfolio of stocks and bonds with a combined effective yield of just 2.1%. Not only is this combined effective yield of stocks and bonds the lowest in market history (chart above), it is also below the market’s current expected inflation rate of 2.4% over the next decade.
With the effective yield of a 60/40 portfolio of stocks and bonds having declined below the expected inflation rate, it suggests that not only has an era of negative real interest rates arrived, an era of negative real effective yield for investors has arrived as well. The chart above amounts to a summary statistic of current equity market and bond market valuations, and with data going back 140 years, stocks and bonds have never offered a combined effective yield — cyclically adjusted earnings from stocks, along with coupon payments from bonds — less than they are offering now. If the market’s expected inflation rate of 2.4% over the next decade proves accurate, a balanced portfolio of stocks and bonds currently offers investors a real effective yield of negative 0.3%.
The underlying effective yield of 2.1%, or a negative 0.3% real yield, would equal the total return investors receive from stocks and bonds if two specific conditions are met in the years ahead: 1) bonds held in the portfolio are held to maturity; and 2) the valuation of the broader equity market remains at today’s elevated level. If either of those conditions is not met, the total return of a portfolio of stocks and bonds over the next decade will be different than its effective yield.
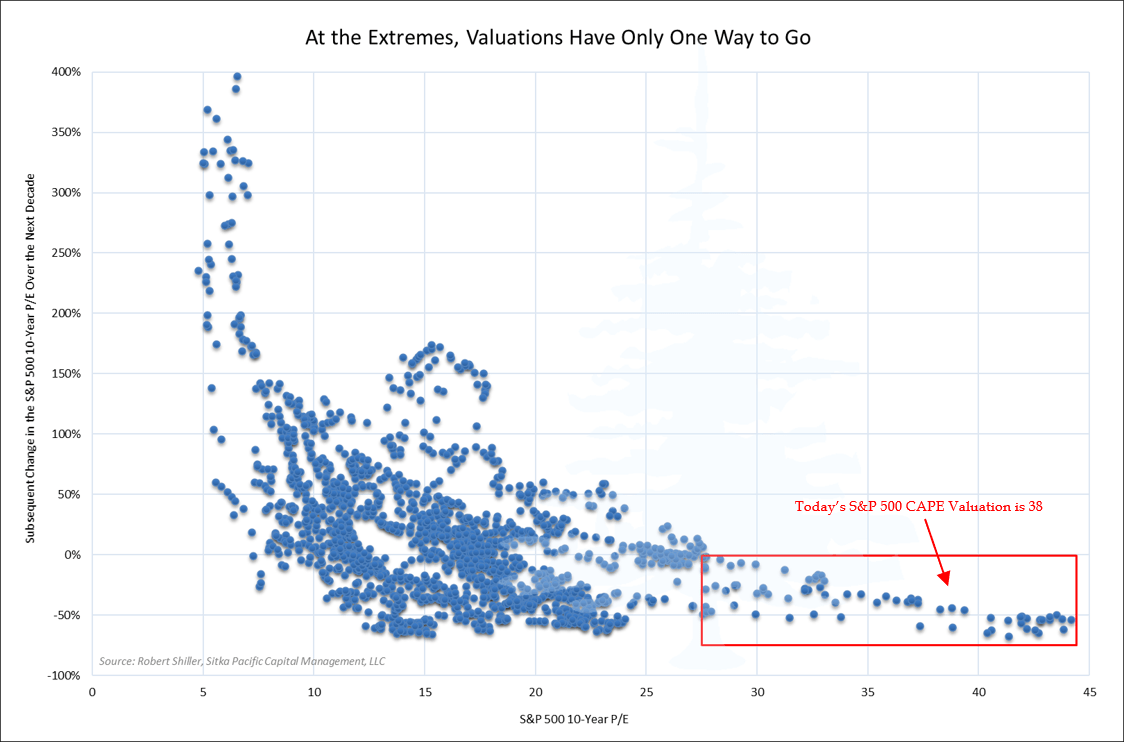
A higher return from a 60/40 portfolio would result from bond yields declining further, and bond holdings being sold to capture the gains in bond prices as yields fell. A higher portfolio return would also result from an equity market valuation that is higher a decade from now. These higher-than-expected portfolio returns would require bond yields to decline meaningfully below the record-low 0.4% yield on the 10-Year Treasury note seen in 2020, and it would also require the equity market to do something it has never been able to achieve: maintain itself on a permanently high plateau. As the chart below highlights, valuations have never remained at today’s lofty levels over time.
In recent years, it has become almost commonplace to expect market events which “have defied all market history,” and this has especially been the case in the wake of the monetary and fiscal response to the pandemic. The downturn that began in February 2020 progressed at a speed which had not occurred before, and the policy response was on a scale that hearkened back to before the post-war era. The Federal Reserve responded by buying as much debt in three months last year as it did in the entire decade after the financial crisis in 2008, and it also provided a backstop to corporate bonds for the first time in its history; for the pioneering Federal Reserve governors of a century ago, all of whom subscribed to the real bills doctrine and firmly believed a central bank had no business taking credit risk onto its balance sheet, the actions of the Fed over the past year would have seemed utterly alien. At the same time, the federal government provided a fiscal response equivalent to the deficit spending seen during World War II.
These actions flooded the economy and financial markets with trillions of dollars over the past year, and it was no coincidence that such an unprecedented flood of new money produced market outcomes which were also unprecedented. The most consequential has been the decline in long-term yields, which are tied to the market’s expectation that the Fed will end up keeping short-term interest rates near zero far longer than it did after the financial crisis — regardless of other factors, including inflation. Zero percent interest rates, ultra-low long-term bond yields, quantitative easing and subdued inflation rates near 2% have propelled risk asset valuations into rarefied air. This rarefied air is highlighted in the chart above, which shows how far off in the “tail” of the distribution of historical valuations the market is today. It is also highlighted in the distribution below, which shows that the market’s valuation today has only been seen under idyllically benign inflation conditions.
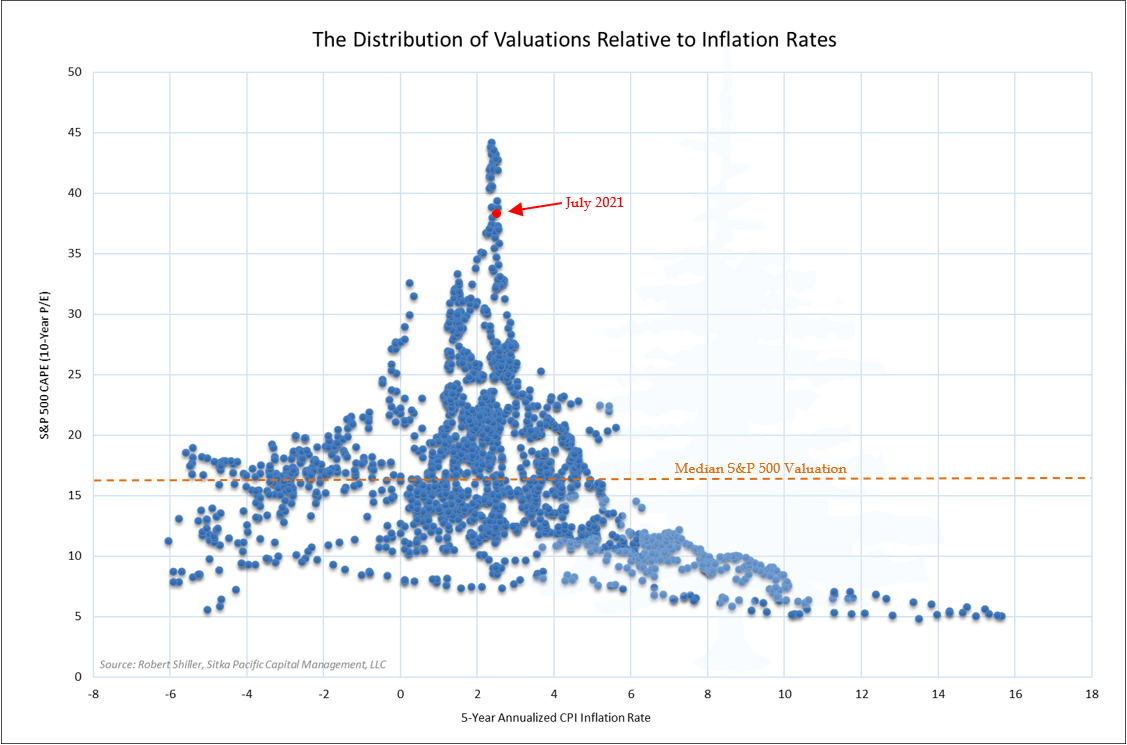
The chart above gives a visual sense of just how fragile these circumstances are. In recent months, year-over-year increases in the Consumer Price Index (CPI) have been close to 5%, and these few elevated readings have been enough to increase the rise in the CPI over the past 5 years from an annualized rate of 1.66% to an annualized rate of 2.39%. Although it appears likely these recent elevated CPI readings will moderate at some point, as they have been driven by large increases in sub-components of the CPI which probably won’t last, the chart above highlights how little inflation it would take to upset the ideal conditions supporting the market’s current valuation.
The question most relevant to investors, that of prospective future market returns, is a question that appears to have no satisfactory answer. Now that long-term bond yields have descended to record lows, and stocks have risen to valuations only seen during a bubble, the standard 60/40 portfolio of stocks and bonds is offering zero effective real yield. And earning a zero percent real return depends on the fragile conditions prevailing today remaining intact more or less indefinitely. If they do not remain intact, and yields begin to rise and/or valuations begin to fall, real returns from a standard portfolio of stocks and bonds will quickly sink deeply into negative territory.
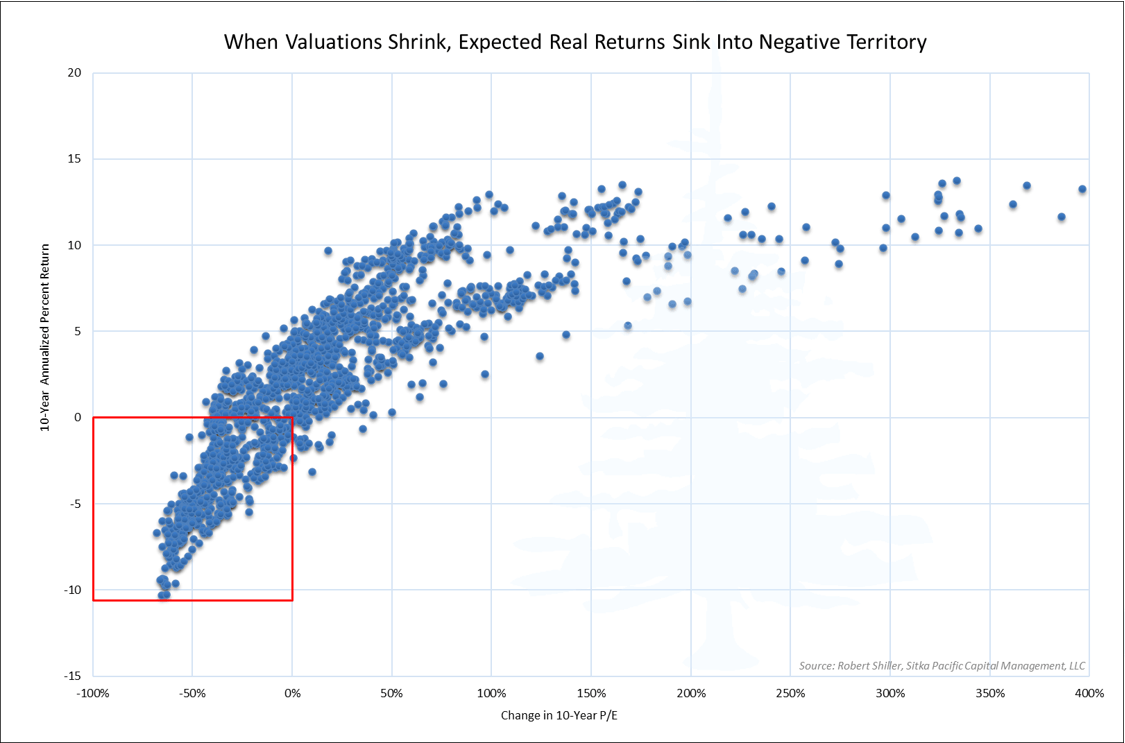
After such a long period of rising valuations, it may be hard to remember how difficult it is to earn a positive return in stocks when valuations begin to shrink over an extended period of time. When the market began the last such period of shrinking valuations, following the tech bubble, safe-haven long-term Treasury bonds offered investors a yield near 6%. Not only was such a yield high relative to the 1% nominal yields of today, it was also high relative to inflation: the CPI advanced at a 2.4% annualized rate in the ten years after the tech bubble peak. This provided investors with a 3.6% real yield on their bond holdings, and this return from bonds cushioned the negative real return from stocks in the decade after the tech bubble. However, with yields throughout the bond market already below the likely rate of inflation in the years ahead, the standard portfolio has no such refuge.
This all adds up to a market environment that currently offers the lowest prospective return for a diversified portfolio of stocks and bonds in market history, in line with the lowest portfolio yield highlighted earlier. One of the most pervasive arguments today is that investors have no alternative than to remain invested in stocks, because they now represent the last positive real return available. This argument is true, up to a point. While the earnings yield of the broader U.S. equity market does remain marginally above the likely inflation rate, in order for investors to receive a positive real return from stocks, valuations will have to remain high or keep climbing. If valuations instead revert to their historical norms over the next decade, returns from stocks will be closer to those shown below, and the real return of a 60/40 portfolio will likely be well below zero.
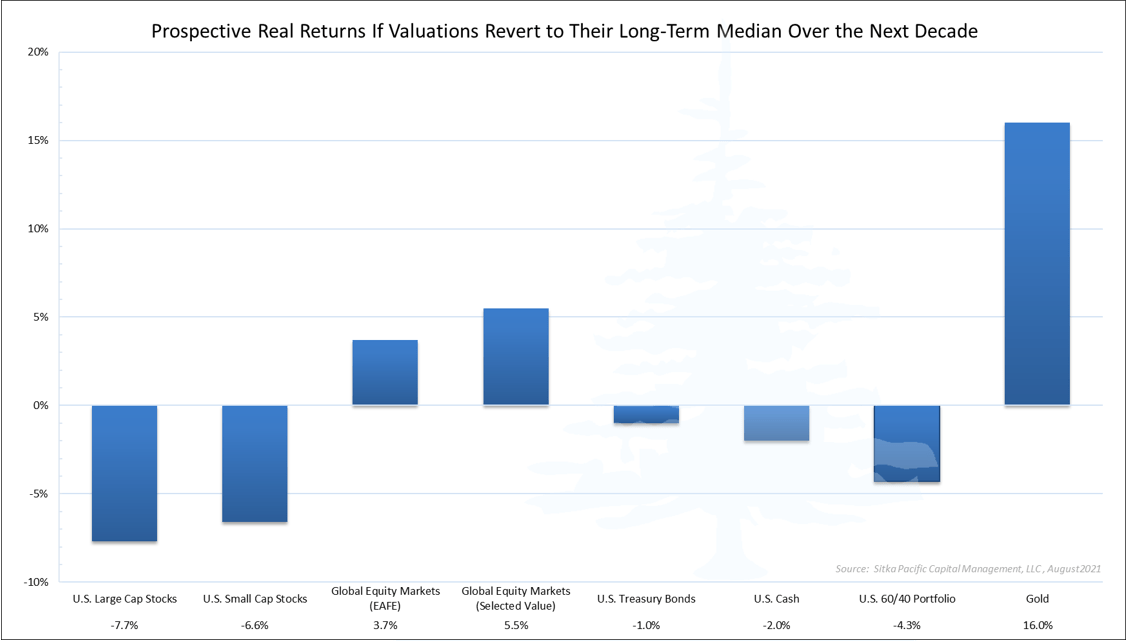
Although the returns shown above may not seem possible amid the exuberant sentiment today, they would simply be the result of the Bountiful Triple Dip of recent years unwinding itself and the market returning to historical norms. That unwinding process has been the end result of every overvalued market in the past. It would be a typical outcome, not an exceptional one.
When investors (and investment managers) restrict themselves to U.S. stocks and bonds, today’s market environment presents a particularly difficult dilemma, one which has twisted relative value arguments almost beyond recognition. However, the end result will likely be quite simple: the new era of negative real interest rates will eventually be joined by an era of negative real returns for the standard 60/40 portfolio of U.S. stocks and bonds.
* * *
The above is part 1 of our July/August 2021 letter to clients. Part 2, Allocating as the Fed and Other Central Banks Begin to Tolerate Higher Inflation, is available in the full PDF version of this letter at Recent Memos, Articles and Client Letters, along with other recent letters in their entirety.
Follow Sitka Pacific at LinkedIn
Sitka Pacific Capital Management, LLC is an absolute return asset manager helping investors and advisors gain stability and independence from the markets. The content of this article is provided as general information only and is not intended to provide investment or other advice. This material is not to be construed as a recommendation or solicitation to buy or sell any security, financial product, instrument or to participate in any particular trading strategy. Sitka Pacific Capital Management, LLC provides investment advice solely through the management of its client accounts. This article may not be copied, reproduced, republished, or posted, in whole or in part, without prior written consent from Sitka Pacific Capital Management, LLC.
© Sitka Pacific Capital Management, LLC
A Look at Prospective Market Returns Amid a New Era of Negative Real Rates
August 24, 2021
When I look out at what’s been going on the last six months, I see financial mania… The Fed, having pumped asset prices to historically high levels, doesn’t make me feel comfortable. I feel as anxious today as I’ve ever felt about the financial world because of my belief that the Fed has been pumping up asset prices in a way that is creating a bit of an illusion. I think the odds are now sort of one in three—very high—that we will look at this as an epic mistake and one of the great financial calamities of all time.
– Peter Fisher, Federal Reserve Bank of New York, 1985–2001
The Third Great Mistake means there is no longer an alternative to higher inflation, and there is also no pain-free way for monetary policy prevent inflation from spiraling higher than intended. It is reminiscent of the circumstances in the late 1960s, and it is fitting that financial markets appear to be in a similar position as well: interest rates are low, risk asset valuations are high, and there is a speculative fervor which has apparently concluded that the entire equity market is now a one decision investment.
– 2021 Annual Letter
One theme we have focused on in these letters over the past three years is what a transition into a regime of negative real interest rates looks and feels like, and the long-term consequences such a regime brings for the markets, and for investors. Since it has been fifty-five years since the last extended period of negative real interest rates began, and forty years since that period of negative interest rates ended, few investors today have any experience navigating such a market environment. For those who do, the memories are distant.
Most investors active in the markets today have only known a market environment defined by positive real rates of return on bonds and stocks, and over the past forty years this environment has been further defined by inflation rates that continuously trended lower. These are trends which supported ever higher valuations for risk assets, and ever longer effective durations for bonds, in a repeat of Warren Buffett’s Bountiful Triple Dip — one of the topics in this year’s annual letter. This regime had been firmly in place since the early 1980s, but it appears increasingly likely we may be witnessing its end. Evidence of the emergence of a new regime has been popping up all around the market landscape over the last year, and it can clearly be seen in the wake of the pivotal June meeting of the Federal Reserve’s rate-setting committee, the FOMC.
In the weeks after Fed Chair Jerome Powell confirmed that the FOMC had begun discussing at its June meeting when it might be appropriate to begin scaling back the pace of its extraordinary balance sheet expansion, yields on long-term Treasury yields continued a slide that had begun in May, when the first rumblings of a policy shift discussion were heard. At the same time Treasury yields fell, the market’s estimates of long-term inflation bucked the trend in yields and remained elevated, with the result being that expected real, inflation-adjusted yields on long-term Treasury securities declined to the lowest rates seen over the past year: the yield on the 10-Year Treasury Inflation-Protected security fell to a new low of -1.19%.
This reaction in the bond market was notable because it was the opposite of the reaction during the Taper Tantrum of 2013, when Treasury yields immediately shot higher when the possibility of tapering the pace of QE was first mentioned. This time, long-term Treasury yields tumbled, with the yield on the 30-Year Treasury bond falling as low as 1.78% in July.
As the entire Treasury yield curve descended below the Federal Reserve’s long-term inflation target of 2% in reaction to the tapering discussion, one conclusion the bond market appeared to reach was that any tapering of asset purchases would result in the Fed Funds rate remaining at zero for a longer period of time. With short-term interest rates at zero, and with the Fed’s $8.2 trillion balance sheet still expanding at a rate of $1.4 trillion a year, this is an extraordinary reaction. A nominal 10-Year Treasury yield trading near 1.2%, below the lowest levels seen in the last decade, suggests there may now be a new working definition of what tightening monetary policy effectively means.
Whereas before private sector deleveraging commenced it took an increase in real interest rates well above zero to cool the economy enough for inflation to subside (at the peak of the tech bubble, short-term interest rates peaked above 6%, which was 2.7% above the inflation rate at the time), the message from the bond market in recent months suggests that today’s modestly negative real interest rates alone will not be enough fuel for the Fed’s preferred inflation indexes to keep rising at a pace that meets the long-term inflation target of 2%. Ongoing quantitative easing may be needed as well.
In such a policy framework, tightening monetary policy would involve slowing the pace of QE until inflation rates and inflation expectations subside, then increasing the pace of QE to raise inflation rates and expectations when they fall too low, all while keeping short-term interest rates at zero — well below the inflation rate. While this prospect of perpetual quantitative easing coupled with negative real short-term interest rates may sound like a far-fetched scenario, it is just the outcome implied by the bond market in June and July, as the entire Treasury yield curve fell deeper into negative real territory when the prospect of tapering asset purchases appeared on the horizon.
The initial market reactions to the emergence of this new monetary regime — zero percent interest rates along with perpetual quantitative easing — have resulted in a long list of never-before-seen events and milestones over the past year, which have left many investors, even those with legendary careers spanning decades, scratching their heads. For just one example, in recent months the yield of some corporate bonds rated below investment grade has declined below the expected inflation rates over the bonds’ duration. While the idea of receiving a negative inflation-adjusted yield on the safest bonds came to be seen as somewhat rational after the chaos of the credit crisis, the desire to invest in risky corporate bonds with a negative expected real yield is more difficult for many experienced investors to fathom. Yet as bewildering as they seem, there is a common theme running through many of these incongruous events and milestones, and it is what we have focused on discussing in recent years: the transition to a negative real rate environment.
While the conversation amongst economists since June has been dominated by a high-frequency debate about when the Federal Reserve will begin tapering the rate of its asset purchases, and the subsequent timing of when short-term rates will cyclically lift off from zero, the market has been sending a different message which is far more consequential for investors. The core of this message is that in order to make meaningful progress toward achieving the goals of its dual mandate in the years ahead, the Federal Reserve is now in the awkward position of having to maintain short-term interest rates below the rate of inflation. And the primary reason the yields of the 10-Year Inflation-Indexed note (shown above) as well as the 30-Year Inflation-Indexed bond are trading in negative territory is that the market is expecting the Fed will remain in this awkward position for an extended period of time. A regime of negative inflation-adjusted interest rates and bond yields has arrived, and the effects of this phase shift have been propagating through the financial markets this year.
With Treasury bonds and more risky corporate bonds now offering a yield below the expected rate of inflation, investors have been scrambling for investments with a positive real yield. Yet as the equity market has climbed over the past year, its effective yield — the underlying cyclically adjusted earnings yield — has declined along with it, and this has left the standard 60/40 portfolio of stocks and bonds with a combined effective yield of just 2.1%. Not only is this combined effective yield of stocks and bonds the lowest in market history (chart above), it is also below the market’s current expected inflation rate of 2.4% over the next decade.
With the effective yield of a 60/40 portfolio of stocks and bonds having declined below the expected inflation rate, it suggests that not only has an era of negative real interest rates arrived, an era of negative real effective yield for investors has arrived as well. The chart above amounts to a summary statistic of current equity market and bond market valuations, and with data going back 140 years, stocks and bonds have never offered a combined effective yield — cyclically adjusted earnings from stocks, along with coupon payments from bonds — less than they are offering now. If the market’s expected inflation rate of 2.4% over the next decade proves accurate, a balanced portfolio of stocks and bonds currently offers investors a real effective yield of negative 0.3%.
The underlying effective yield of 2.1%, or a negative 0.3% real yield, would equal the total return investors receive from stocks and bonds if two specific conditions are met in the years ahead: 1) bonds held in the portfolio are held to maturity; and 2) the valuation of the broader equity market remains at today’s elevated level. If either of those conditions is not met, the total return of a portfolio of stocks and bonds over the next decade will be different than its effective yield.
A higher return from a 60/40 portfolio would result from bond yields declining further, and bond holdings being sold to capture the gains in bond prices as yields fell. A higher portfolio return would also result from an equity market valuation that is higher a decade from now. These higher-than-expected portfolio returns would require bond yields to decline meaningfully below the record-low 0.4% yield on the 10-Year Treasury note seen in 2020, and it would also require the equity market to do something it has never been able to achieve: maintain itself on a permanently high plateau. As the chart below highlights, valuations have never remained at today’s lofty levels over time.
In recent years, it has become almost commonplace to expect market events which “have defied all market history,” and this has especially been the case in the wake of the monetary and fiscal response to the pandemic. The downturn that began in February 2020 progressed at a speed which had not occurred before, and the policy response was on a scale that hearkened back to before the post-war era. The Federal Reserve responded by buying as much debt in three months last year as it did in the entire decade after the financial crisis in 2008, and it also provided a backstop to corporate bonds for the first time in its history; for the pioneering Federal Reserve governors of a century ago, all of whom subscribed to the real bills doctrine and firmly believed a central bank had no business taking credit risk onto its balance sheet, the actions of the Fed over the past year would have seemed utterly alien. At the same time, the federal government provided a fiscal response equivalent to the deficit spending seen during World War II.
These actions flooded the economy and financial markets with trillions of dollars over the past year, and it was no coincidence that such an unprecedented flood of new money produced market outcomes which were also unprecedented. The most consequential has been the decline in long-term yields, which are tied to the market’s expectation that the Fed will end up keeping short-term interest rates near zero far longer than it did after the financial crisis — regardless of other factors, including inflation. Zero percent interest rates, ultra-low long-term bond yields, quantitative easing and subdued inflation rates near 2% have propelled risk asset valuations into rarefied air. This rarefied air is highlighted in the chart above, which shows how far off in the “tail” of the distribution of historical valuations the market is today. It is also highlighted in the distribution below, which shows that the market’s valuation today has only been seen under idyllically benign inflation conditions.
The chart above gives a visual sense of just how fragile these circumstances are. In recent months, year-over-year increases in the Consumer Price Index (CPI) have been close to 5%, and these few elevated readings have been enough to increase the rise in the CPI over the past 5 years from an annualized rate of 1.66% to an annualized rate of 2.39%. Although it appears likely these recent elevated CPI readings will moderate at some point, as they have been driven by large increases in sub-components of the CPI which probably won’t last, the chart above highlights how little inflation it would take to upset the ideal conditions supporting the market’s current valuation.
The question most relevant to investors, that of prospective future market returns, is a question that appears to have no satisfactory answer. Now that long-term bond yields have descended to record lows, and stocks have risen to valuations only seen during a bubble, the standard 60/40 portfolio of stocks and bonds is offering zero effective real yield. And earning a zero percent real return depends on the fragile conditions prevailing today remaining intact more or less indefinitely. If they do not remain intact, and yields begin to rise and/or valuations begin to fall, real returns from a standard portfolio of stocks and bonds will quickly sink deeply into negative territory.
After such a long period of rising valuations, it may be hard to remember how difficult it is to earn a positive return in stocks when valuations begin to shrink over an extended period of time. When the market began the last such period of shrinking valuations, following the tech bubble, safe-haven long-term Treasury bonds offered investors a yield near 6%. Not only was such a yield high relative to the 1% nominal yields of today, it was also high relative to inflation: the CPI advanced at a 2.4% annualized rate in the ten years after the tech bubble peak. This provided investors with a 3.6% real yield on their bond holdings, and this return from bonds cushioned the negative real return from stocks in the decade after the tech bubble. However, with yields throughout the bond market already below the likely rate of inflation in the years ahead, the standard portfolio has no such refuge.
This all adds up to a market environment that currently offers the lowest prospective return for a diversified portfolio of stocks and bonds in market history, in line with the lowest portfolio yield highlighted earlier. One of the most pervasive arguments today is that investors have no alternative than to remain invested in stocks, because they now represent the last positive real return available. This argument is true, up to a point. While the earnings yield of the broader U.S. equity market does remain marginally above the likely inflation rate, in order for investors to receive a positive real return from stocks, valuations will have to remain high or keep climbing. If valuations instead revert to their historical norms over the next decade, returns from stocks will be closer to those shown below, and the real return of a 60/40 portfolio will likely be well below zero.
Although the returns shown above may not seem possible amid the exuberant sentiment today, they would simply be the result of the Bountiful Triple Dip of recent years unwinding itself and the market returning to historical norms. That unwinding process has been the end result of every overvalued market in the past. It would be a typical outcome, not an exceptional one.
When investors (and investment managers) restrict themselves to U.S. stocks and bonds, today’s market environment presents a particularly difficult dilemma, one which has twisted relative value arguments almost beyond recognition. However, the end result will likely be quite simple: the new era of negative real interest rates will eventually be joined by an era of negative real returns for the standard 60/40 portfolio of U.S. stocks and bonds.
* * *
The above is part 1 of our July/August 2021 letter to clients. Part 2, Allocating as the Fed and Other Central Banks Begin to Tolerate Higher Inflation, is available in the full PDF version of this letter at Recent Memos, Articles and Client Letters, along with other recent letters in their entirety.
Follow Sitka Pacific at LinkedIn
Sitka Pacific Capital Management, LLC is an absolute return asset manager helping investors and advisors gain stability and independence from the markets. The content of this article is provided as general information only and is not intended to provide investment or other advice. This material is not to be construed as a recommendation or solicitation to buy or sell any security, financial product, instrument or to participate in any particular trading strategy. Sitka Pacific Capital Management, LLC provides investment advice solely through the management of its client accounts. This article may not be copied, reproduced, republished, or posted, in whole or in part, without prior written consent from Sitka Pacific Capital Management, LLC.
© Sitka Pacific Capital Management, LLC
Investment Management
Before investing, we will discuss your goals and risk tolerances with you to see if a separately managed account at Sitka Pacific would be a good fit. To contact us for a free consultation, visit Getting Started.
Macro Value Monitor
To read a selection of recent client letters and be alerted when new letters are posted to our public site, visit Recent Client Letters.